Debugging techniques in SAP refer to various methods and tools that are used by SAP developers to analyze and debug SAP programs, identify issues, and fix errors. Debugging is an essential part of software development, and it allows developers to step through their code, check variable values, and identify the root cause of errors.
Advantages of Debugging Technique
Here are some of the advantages of using debugging technique in SAP:
-
Pinpointing the exact cause of an issue: Debugging allows developers to identify the exact line of code that is causing the problem. This helps in quickly identifying and fixing issues.
-
Efficient use of resources: Debugging allows developers to quickly identify and fix issues, which saves time and resources. It eliminates the need for developers to spend time manually tracing through code to find the root cause of a problem.
-
Enhanced program logic: Debugging allows developers to step through the code and observe how it executes. This provides a better understanding of the program logic and can help in identifying areas that can be optimized for better performance.
-
Improved code quality: Debugging helps in identifying potential bugs and errors in code. This helps in improving the overall quality of the code, which in turn leads to better program performance and fewer issues.
-
Better collaboration among teams: Debugging allows developers to work closely with other team members to identify and fix issues. This leads to better collaboration and more efficient problem-solving.
How to Open SAP ABAP Debuffer?
Please follow the steps below to open the ABAP debugger in SAP, follow these steps:
In the SAP GUI, go to the main menu and navigate following path:
Tools > ABAP Workbench > Development > ABAP Editor
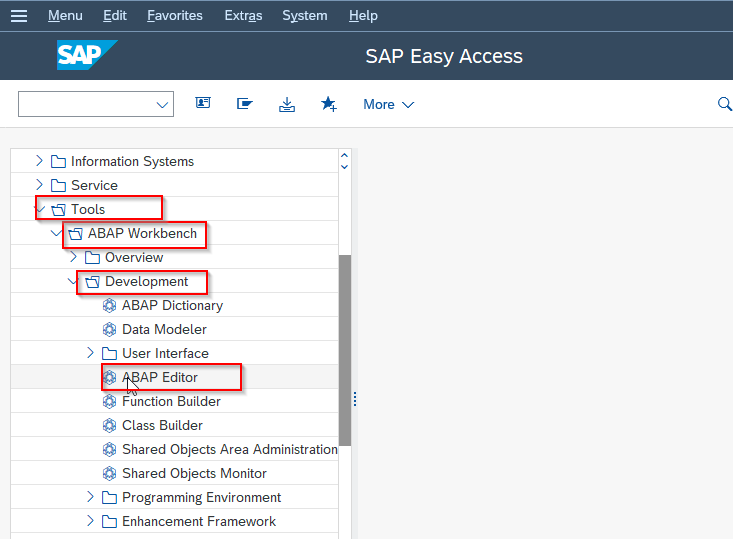
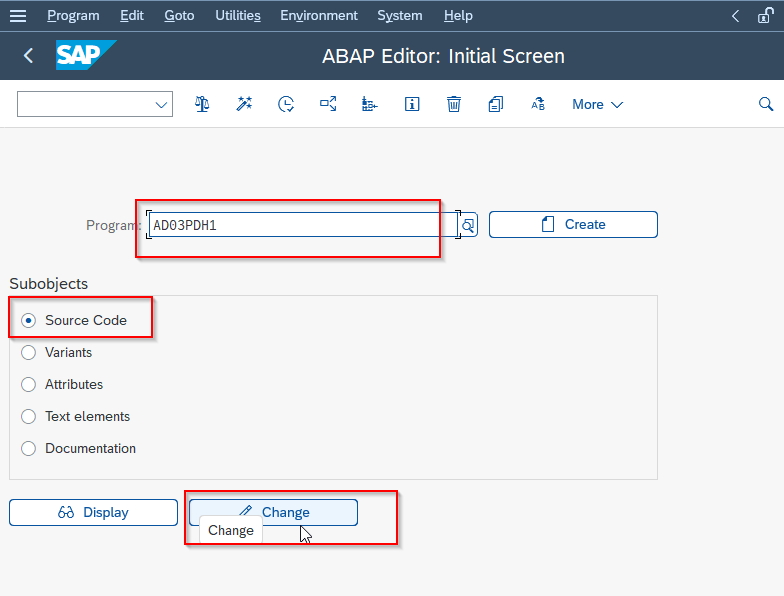
Next on the ABAP Editor, select the program you want to debug and click on the Change button
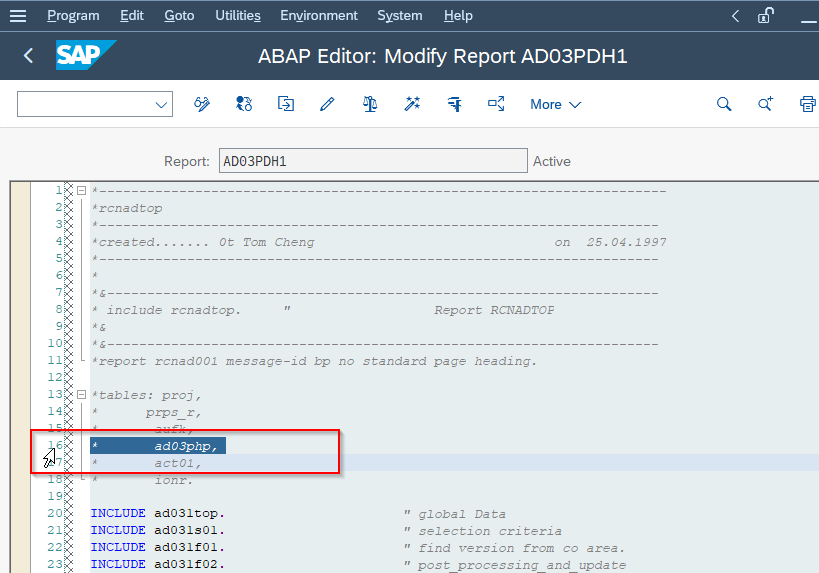
Now click on the line number where you want to set a breakpoint. Alternatively, you can use the F5 shortcut key to set a breakpoint.
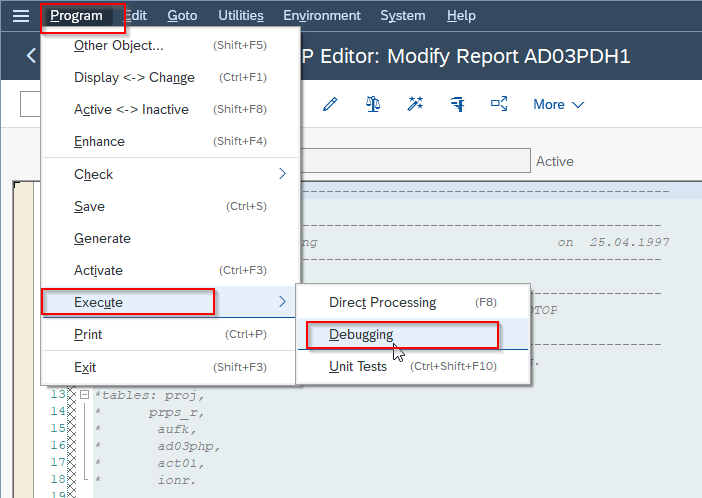
At last to start debugging, click on the Debugging button in the toolbar or press the Ctrl+Shift+F5 shortcut key.
Alternatively, you can also start debugging by using the Start Debugging button in the ABAP Editor toolbar. This will open the debugger interface and allow you to set breakpoints and debug the program.
Types of Deubbging Techniques in ABAP
1) Classic Debugging
Classic debugging is the most commonly used debugging technique in SAP ABAP. It involves setting breakpoints in the code to pause the execution of the program and allow developers to inspect the values of variables, tables, and other data objects.
2) New ABAP Debugger
The New ABAP Debugger is an enhanced version of the classic debugger in SAP ABAP that provides additional features and functionality for debugging programs. Some of the features of the new debugger include debugging multiple sessions simultaneously, code coverage analysis, code profiling, improved user interface etc.
3) Debugging of Web Dynpro Applications
Web Dynpro is a technology used in SAP for developing web-based user interfaces. Debugging of Web Dynpro applications involves using the Web Dynpro Debugger to identify and fix issues.
Switching between the ‘Classic Debugger’ and ‘New Debugger’
Execute t-code SE38 (ABAP Editor) in the SAP command field
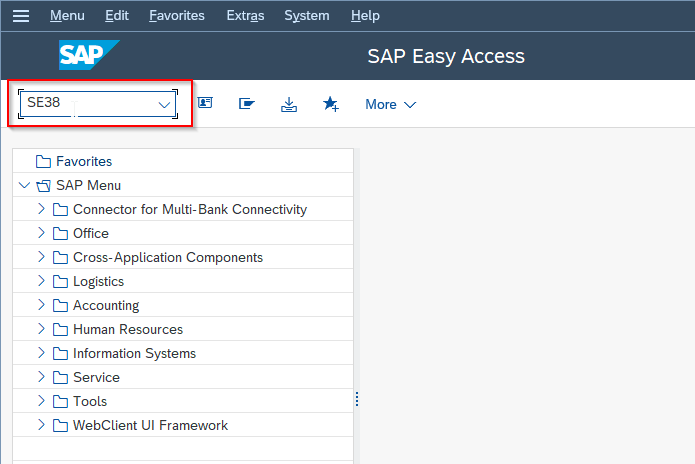
Go to Utilities > Settings
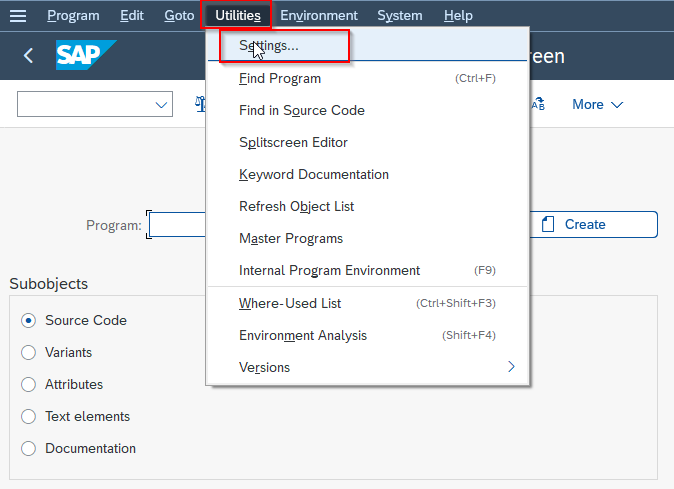
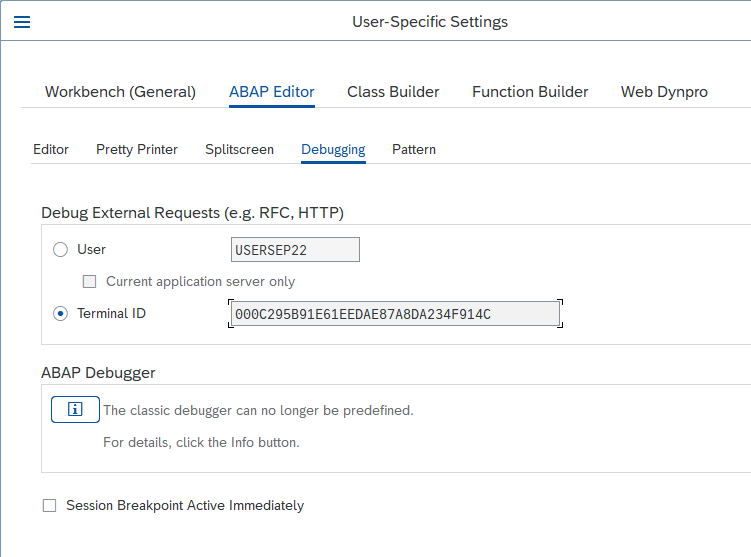
Next on the User-Specific Settings screen click on ABAP Editor > Debugging tab.
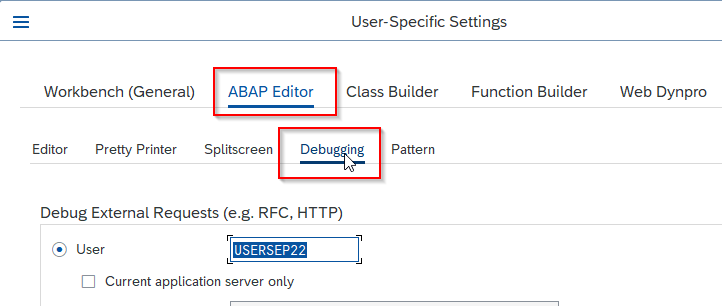
Now the user can choose the New Debugger radio button to make it your default debugger.
Shortcut Used for ABAP Debugger
- F5: Set a breakpoint at the current line of code.
- F6: Step over the current line of code without stepping into any function or method calls.
- F7: Step into the current function or method call.
- F8: Skip the current function or method call.
- Ctrl+Shift+F5: Start debugging with the new ABAP debugger.
- Ctrl+Shift+F6: Step through the code line by line with the new ABAP debugger.
- Ctrl+Shift+F7: Step into the current function or method call with the new ABAP debugger.
- Ctrl+Shift+F8: Skip the current function or method call with the new ABAP debugger.
- Ctrl+Shift+F11: Display the watchpoints window, where developers can set and manage watchpoints.
- Ctrl+Shift+F12: Display the breakpoint editor, where developers can set and manage breakpoints.
Working With Debugging Techniques
Objectives
- Online debugging tools
- Starting the debugger
- The debugger’s views
- Using breakpoints
- Setting static breakpoints
- Setting dynamic breakpoints
- Setting watchpoints
- Setting breakpoints at keywords or events
- Deleting and deactivating breakpoints
- Stepping through program codes
- Displaying field contents
- Displaying internal tables
- Displaying ABAP/4 lists
- Replacing field values at runtime
- Changing internal tables at runtime
- Switching to the ABAP/4 editor
- Releasing the database during debugging
Online Debugging Tools: A Review
- The ABAP/4 debugger lets you stop a program during runtime and examine the flow and results of each statement during execution.
- Stepping through a program with the debugger helps you to detect and correct errors in your code.This documentation is designed for developers new to the workbench’s debugging facilities or for those who want to learn the tool to use the tool more effectively.
Working With Debugger
- Switch on the debugger
- Set and delete static and dynamic break points.
- Set watch points
- Stop a program at specific key words or events or when a field contents change.
- Continue processing after an interrupt.
- Display field contents during runtime.
- Display the contents of an internal table.
- Change field contents for testing purposes.
- Change the contents of an internal table.
- Display and use debugger’s views.
Contd…………….
- Debugging strategies form within ABAP/4 development work bench. We can set breakpoints in a program and then start the program within the debugger. Alternatively, we can run the program in the debugger without any breakpoints.
- A breakpoint is a signal within a line of code that tells the ABAP/4 runtime processor to interrupt the program at the line. Setting break points is a good strategy if we want to examine a program:
- After the system has already processed certain events
- Just before a specific event is carried out
- By skipping quickly to a specific routines or calls.
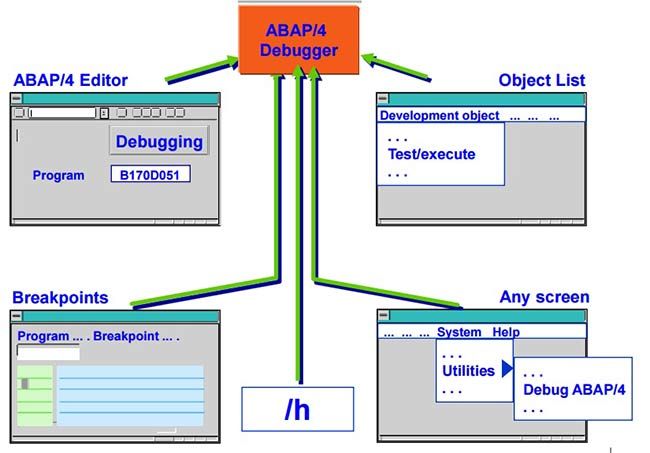
Starting the Debugger
- On running a program in the debugging mode the following steps can be followed.
- In the object browser, Select a report or transaction.
- Choose debugging in the ABAP/4 editor initial screen. Choose Program → Execute → Debugging or choose debugging.
- From any screen , Choose System → Utilities →Debug ABAP/4.
Debugger’s Views
- A debugger selects different views, by selecting appropriate view name in debugger’s menu.
- Purpose of various buttons
- Overview - displays the structure of the program to be debugged.
- Fields - displays the fields content and technical characteristic
- Table - displays the content of an internal table.
- Call stack - displays an active event chain and the call sequence up to the current breakpoint.
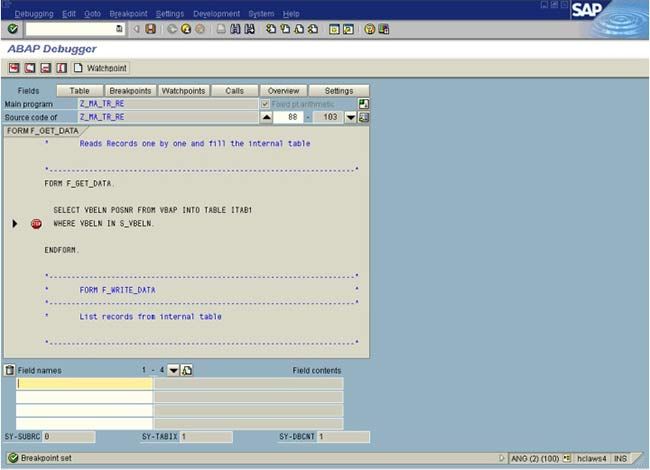
- Structure of the debugging view
- Each debugging view has the same structure. The top half of the screen displays a portion of the programs source code. The lower half shows information specific to that particular view .At the line ‘source code of’ appears two push buttons to scroll through the program code. The line currently ready for processing is indicated by “>”.A small stop sign appears to the left of each dynamic break point.
Using Breakpoints
- A breakpoint is a signal within a program’s code, which tells the ABAP/4 processor to interrupt the program at a particular point. The type of breakpoint depends on the purpose of debugging.
ABAP Debugging Screen
Types of Breakpoints
- Static These are user-independent, set directly into a program’s code with the editor. User-dependent breakpoints also are possible.
- Dynamic Set within the ABAP/4 debugger or editor. This type is visible when the program is displayed in the editor.
- Watch points Set within the ABAP/4 debugger. Watch points are field-specific. This is used to observe changes in a particular field . The debugger interrupts the program when the field's content changes.
Event Breakpoints, Static Breakpoints, Dynamic Breakpoints
- Key word (statement) or event breakpoints Set within the ABAP/4 debugger. The debugger interrupts the program when the ABAP/4 processor comes in contact with a specific key word (statement) or event in program’s code.
- When a static breakpoint is used?
Static break point are generally user-independent. On setting this breakpoint , every use who executes the program encounters the breakpoint. This is used when several developers are working in the same program, and all wants to the program to interrupt at the same place during execution.
These breakpoints are visible in the program's code.
A dynamic breakpoint is user-specific. If we want to interrupt a program when we execute and while others are running, we use dynamic break-point. Dynamic breakpoints are more flexible than static breakpoints, they can be removed or deactivated during runtime.
We can set watchpoints only from within the debugger. They are useful if we want to interrupt a program only when there is a change in a particular field or a field string. We can set and remove watch points as needed. This, as a dynamic breakpoint, does not disturb the other users of the same program.
- When a dynamic breakpoint is used?
- When to use watchpoints.
When to Use…..
- When to use breakpoints at keywords (statements) or events. From within the debugger, we can allocate breakpoints for specific ABAP/4 keywords or program events. This is useful if we do not know exactly where a keyword or event occurs, but still want the program to be interrupted just before the command or event is carried out.
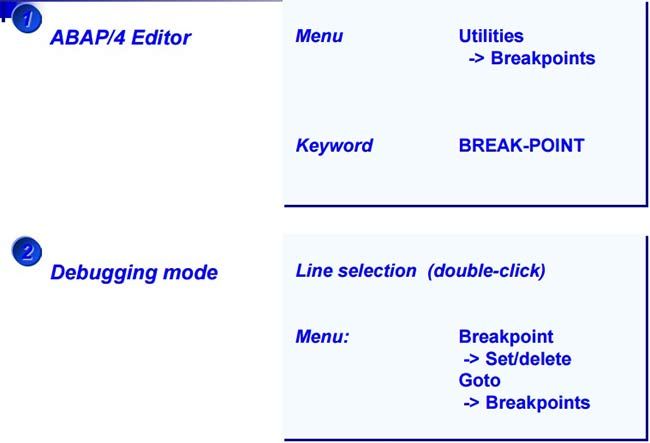
- Setting static breakpoints. To set a static breakpoint use the ‘BREAK-POINT’ keyword. Place the breakpoint on the line where to interrupt the program:
Contd…..

Report rsdebug1

……………

Check account

If SY-SUBRC NE 0.

Break-point.

ENDIF.

…….
- When we start the report , ABAP/4 interrupts the processing at the break point.
- We can number breakpoints like BREAK-POINT1 ,BREAK-POINT2..For easier identification.
Removing Breakpoints
It is necessary to remove the breakpoints after debugging. Use function Utilities → Global search to help in locating break-points in larger programs. It is necessary to remove breakpoints since it may cause serious disruptions in productive process.
Setting Dynamic Breakpoints
We can set a dynamic breakpoint, without changing the program’s code. Following are the steps to set a breakpoint in ABAP/4 Editor.
- Place the cursor on the line where to position the breakpoint.
- Choose Utilities --> Breakpoint → Set or press the ‘stop’ pushbutton at the top.
- A display of all breakpoints in a program can be obtained by selecting Utilities → Breakpoint → Display.
- The dynamic breakpoint display leads to navigating to a certain breakpoint or deleting one or all breakpoints from the program code.
Setting Watchpoints
- A watchpoint is set to interrupt a program when the contents of a specific field or a string change.
- Following are the steps to set a watchpoint.
- On the debugging editor, enter the table field.
- Press the pushbutton ‘Watchpoint’ on the top left.
- A dialog box appears, asking for the ‘local watch point’,
- Relational operator and comparison field. Fill in as per requirement.
- Fill in the appropriate value in the text field next and press the tick.
- A display of watchpoints can be viewed by goto-->control debugging--> Watchpoint.
Setting Breakpoints at (Statements) Keywords or Subroutines
- If we want to interrupt the program director before a certain keyword event or a subroutine, we use this facility.
- We can achieve this with the following steps in the editor.
- Choose either Breakpoint Breakpoint at Statement or subroutine or function module.
- The system will display a small screen prompting you to enter a statement keyword or subroutine etc., as per requirement.
- The system will set a breakpoint each time the statement, or subroutine appears in the program.
- For break points in form routines, it is possible to access the current program, not external subroutine calls.
Deleting a Dynamic Break-point
- To delete a dynamic breakpoint, place the cursor in a line and choose Breakpoint → Set/Delete or Delete.
- Deleting this breakpoint is also possible by double-clicking the appropriate line.
- From within the editor, deleting the dynamic breakpoint is done by the following steps.
- Choose Goto--> Control Debugging-->Breakpoint.
- The System will list all the breakpoints.
- Select one breakpoint.
- Choose an individual by double-clicking on the icon ‘Stop’
- and it deletes .
- Temporary deleting of Dynamic breakpoint is possible by selecting the appropriate line and selecting Breakpoint Deactivate/Activate in the abap Debugger.
Deleting Watchpoints
- Watch points are special breakpoints set for specific fields. To remove a watchpoint, the following steps will do.
- Choose Goto --> Control debugging-->Watchpoint. A display of the watch point occurs and can be deleted by pressing the ‘delete’ checkbox at the end of each Watchpoint.
- Displaying the Location of breakpoints.
- Select Goto--> Control Debugging -->Breakpoints to get an overview of all existing breakpoints in a program’s code. From the breakpoint display , it is possible to set or delete individual breakpoints.
Stepping Through Program Code
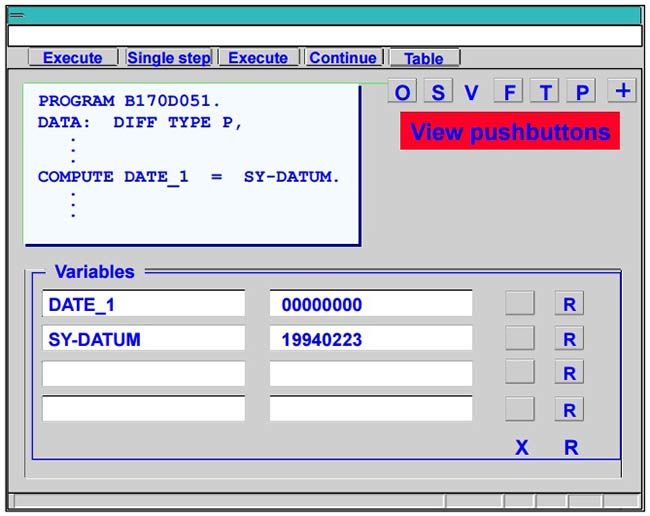
From within the debugger several options for stepping through the program
- Single step: execute a program statement by statement. If single step is chosen while on a line that calls a FORM routine , for example the next mouse click carries to the called routine. After stepping the way through the subroutine, returns to the line of code directly following the subroutine call.
- Execute: process a program line by line. On choosing execute while on a line, that calls a FORM routine, the debugger executes the subroutine subroutine and halts at the line of code directly following the call. Thus this skips over the lines of the subroutine itself.
- Continue: processes the program up to the next active dynamic or static break point. If no further breakpoints exists, the system executes the report in its entirety without stopping.
- Return: returns the debugger to where a calling program resumes control.Can be used from within a subroutine call.
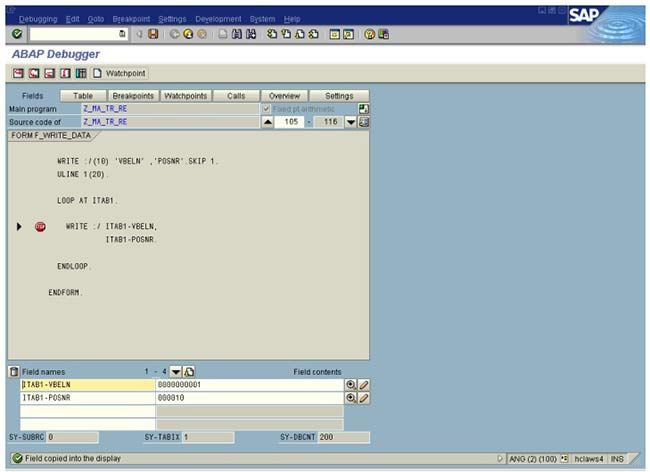
Displaying the Field Contents
While debugging display of the critical of the critical contents of the fields are possible.
- Display of the contents up to eight fields or field strings can be done. We can enter the field names directly in the spaces provided or double click the field in the code display and the system lists it as a variable automatically.
- We can use the variable screen to display the contents of any system field or all field that a program references. Also the debugger to display fields defined in the ABAP/4 dictionary can be used.
- To display the contents of dictionary fields, we must define relevant table in the TABLES statement of the current program.
- Additionally the contents of the fields from external programs can be displayed. For this we need to place the name of the external program in brackets in front of the field name.
Displaying Internal Tables
Within the debugger , we can display the contents of an internal table by choosing the table pushbutton.
- The system displays the table view. Specify a table name in the internal table field or double click on the table. If the internal table contains a header line, this line appears before the actual table contents and is marked in the display by >>>>>>>.The table rows are numbered. We can scroll through the table display using the index field or the scroll icons. If we want to see those parts of the tables that are not visible on the left or right of the screen , use the push buttons for horizontal scrolling or simply shift the title bar of the table.
- Using the column header line, we can also change the sequence of the fields we want to see. If we remove a field name from the column header line, then the system deletes the field from the display. If we specify an incorrect field name, the system displays a string of question marks.
A View of Internal Table Display
Contd….
- If the space you leave to display a field is too small , the system truncates the display and indicates this by a “<” character.
- As with the field display , we can customize the display format for internal tables. The standard entry in the format field is an E (for edited) . you can change this to an X for hexadecimal or a C for character display.
- Once we have finished examining the internal table , return to the screen with the field display and program code by selecting the program button.
- Displaying ABAP/4 lists. If we are debugging an online report that generates a list, we can display this list in the debugger. As soon as this list is started, the display list pushbutton appears. Choose display list to switch to the list display. The system displays all the lines generated so far in their respective formats. Note : the current list line is formatted only after completion (NEWLINE).
Replacing Fields at Runtime
- We can change the values of all fields , database tables (with offset) and internal tables referenced in a report . if we alter the values of database fields , we do not change them in the database itself , but only in the work area ABAP/4 provides for one run of the report .The system displays an appropriate message if any format errors occur.
Replace the Value
- We can replace value in the following steps.
-
- Go to the variable display screen. This is the debugger’s default view.
- Double click on a variable to place it in the variables display.
- Enter a new value in the field contents row .
- 4.Choose the ‘change field content’ button.
- ABAP/4 writes the new value back to the program field or fields and the system notes the change in the system log. If we forget to click on the ‘change field content’ push-button , the system ignores the values we entered.
Note: ABAP/4 accepts our entries in the contents column exactly as we specified them. You need to pay special attention to the correct format.( Upper or lower case , right justified output with packed numbers).
Changing Internal Tables at Runtime
The debugger allows to manipulate the contents of an internal table during runtime. We can delete, edit or add a row to an internal table.
- To delete an entry from an internal table:
-
- Go to the table display screen
- Enter the table name in the internal table field.
- Choose enter.The system displays the table’s contents.
- Place the cursor on the line you wish to remove from the table.
- Press ‘delete’ pushbutton.
The line disappears from the table and the system adjusts the line numbering accordingly.
Editing a Row
- The functions change , insert and append are field-specific in the debugger and can be carried out only one field at a time by pressing the respective pushbuttons.
- For example ,if we want to edit the following line:
Lh001 FRANKFURT NEWYORK 145400 400 x, We first need to decide which field to change. Then the following steps must be done.
-
- Place the cursor on the row and field we want to edit.
- Choose change
- Enter a new value for the field.
- Choose enter.
The system updates the line and displays the new contents in the table.
Adding a Row
- We can add a new row to an internal table by using either append or the insert function. Append places the new line at the end of the table. Insert lets us to position the line anywhere.
- To add a new row to the end of the table , the following steps will do.
- Choose append.
- Enter a value for the first field in the line.
- Choose enter. The system adds a line to the table and fills in the first field.
- Enter the remaining fields of the line by following the procedure for editing a row as described above.
- To insert a new line anywhere in the internal table ,position the cursor on the line directly following the line where we want the new row to appear. Then ,choose insert button and proceed as we want to append the line.
Switching to the ABAP/4 Editor
- We can switch from the debugger to ABAP/4 editor at any time. If we discover a program error during the debugging process , for example,we can enter the ABAP/4 editor to immediately correct the error in the program’s code. We can also switch back to the editor in order to set new static break-points.
- After we set static breakpoints in the editor,they are not active in the debugger when we switch back.We must re-generate the program.Then the breakpoints appear in the debugger.
- To return to the editor for the program currently being debugged , Select development-->ABAP/4 editor.
A Representation of Debugging Process - Branching to Debugging Mode
Debugging Mode
The Most Important Debugging Functions
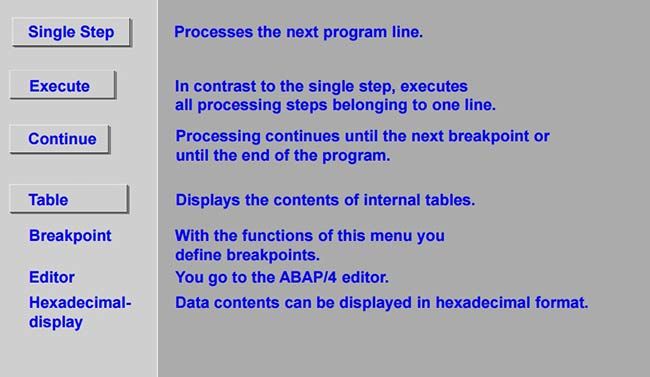
Setting Breakpoints
Important FAQ for Debugging Techniques
- Static break-point are user independent (YES/NO)
Yes
- Dynamic breakpoints are not user-specific(yes/no)
No
- Dynamic breakpoints are visible in the program(yes/no)
Yes
- Dynamic breakpoints are more flexible than static breakpoints(yes/no)
Yes
- Static breakpoints are hard-coded in the program(yes/no)
Yes
- Temporary deletion of dynamic breakpoints are not possible(yes/no)
No
- Watchpoints can be set only from within the debugger (YES/NO).
Yes
- How can a temporary deletion of dynamic breakpoints are done?
ACTIVATE/DEACTIVATE in the debugging editor.
- What are the different options to step through the program in the debugger?
Single step
Execute
Continue
Return
- While debugging ,it is impossible to correct wrong values in a table’s field dynamically during runtime (YES/NO)
No
- Addition and deletion of fields in a table is possible in debugger
Yes
- From the ABAB debugger , switching to ABAP/4 editor is not allowed.
No