Plots are an effective means of visualizing data and gracefully reviewing data. Matplotlib is the most popular data visualization library in Python. It is famous for two significant reasons. One, it has a large variety of plots and charts. Two, it has many customization options; that is, users can tweak just about any component from its objects. In this chapter, you will learn how to change the figure size in matplotlib.
Creating the Plot:
Before changing the size of the figure, you have to create a plot. For this, you have to install the matplotlib library and NumPy library (optional). The command to install matplotlib is:
pip install matplotlib

pip install numpy
Now, create a new project and write the following code:
import matplotlib.pyplot as mpl
import numpy as np
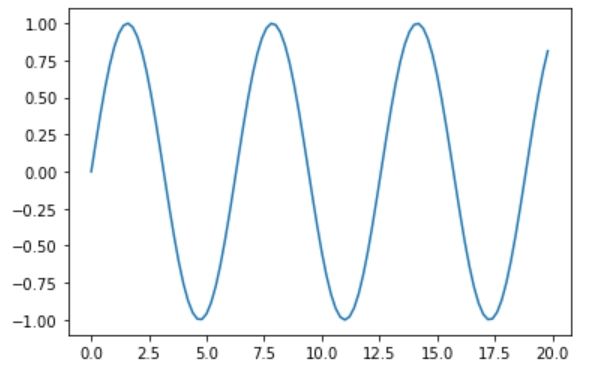
a = np.arange(0, 20, 0.2)
b = np.sin(a)
mpl.plot(a, b)
mpl.show()
Output:
Explanation:
Once you execute this code, you will see that the mpl.plot() will generate a plotted figure with a default size. By default, matplotlib creates a figure of size 10 x 8 inches or its corresponding ratio. But, we can change the figure size. Note that changing the figure size might change the observable element size also.
Change Figure size in Matplotlib:
Changing the figure size will alter your display of the plot with a different size. There are three different methods you can use to change the figure size in Matplotlib.
Method 1: Using the figsize argument:
It is the easiest and popular way of changing the size of a figure created using matplotlib. Programmers can use this argument either with the existing figure object or with any plot (chart's) initialization. It takes two parameters under a single set of parentheses.
By default, the width and height values are 6.4 & 4.8 respectively.
Syntax:
mpl.fig(figsize = (arg1, arg2))
Program:
import matplotlib.pyplot as mpl

# a and b as respective values on x axis & y axis

a = [2, 4, 6, 8, 10]

b = [8, 9, 10, 11, 12]

# Defailt figure size will be shown here

display(mpl.plot(a, b))

# Altering the figure size to 3 x 4

mpl.figure(figsize = (3, 4))

display(mpl.plot(a, b))
Output:

Explanation:
First, we have to import the matplotlib.pyplot module. We have also aliased it with the name ‘mpl’ using the as keyword. Next, we have to create the values of X and Y axes. In this program, we will go with the list data type to create them. We have created the plot using the mpl.plot() and displayed it (this will show the default size). Now, we have again use the mpl to create the figure. The figure() takes the width (here 3) and height (here 4) as the two parameters. Again we have displayed it. This time, it will show the customized size 3x4.
Method 2: Using set_figheight() and set_figwidth():
Rather than using the figsize argument, we can also set the height and width manually using the set_figheight() and set_figwidth() method of the figure object. Both these methods take single argument value.
Syntax:
figure.set_figheight(value)

figure.set_figwidth(value)
Program:
import matplotlib.pyplot as plt
import numpy as np
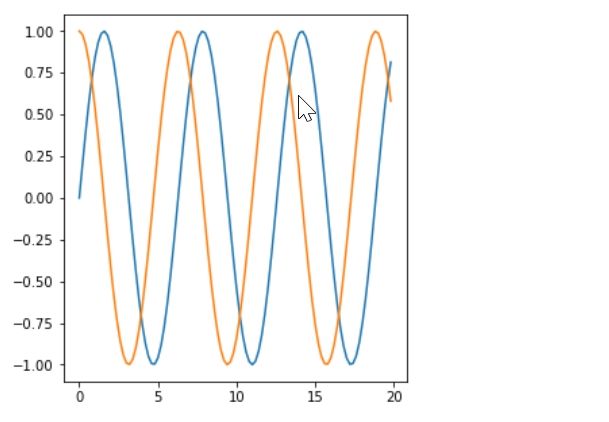
a = np.arange(0, 20, 0.2)
sin1 = np.sin(a)
cos1 = np.cos(a)
figr = plt.figure()
figr.set_figheight(5)
figr.set_figwidth(10)
f = figr.add_subplot(121)
f.plot(a, sin1)
f.plot(a, cos1)
plt.show()
Output:
Explanation:
First, we have to import the matplotlib.pyplot module and the Numpy module. We have also aliased it with the name ‘mpl’ and np using the as keyword. Next, we have to create a range of data using the arange() function of the Numpy. Now, we have to take two new variables sin1 and cos1 and use that arange() data within it. Use figure() to generate the figure.
To change the default size, we have used the set_figheight() and set_figwidth() methods with 5 and 10 as their respective parameter value. Now create the plots and display it using show() method.
Method 3: Using set_size_inches():
Developers also use this method to set the figure size in inches. If anyone uses this method, he/she does not have to write two distinct methods for width and height. It takes two parameters, first one for width and the second one for height.
Syntax:
matplotlib.figure.Figure.set_size_inches(width, height)
Program:
import matplotlib.pyplot as mpl
from matplotlib.figure import Figure
import numpy as np
figr = mpl.figure()
base = figr.add_axes([0.1, 0.1, 0.8, 0.8])
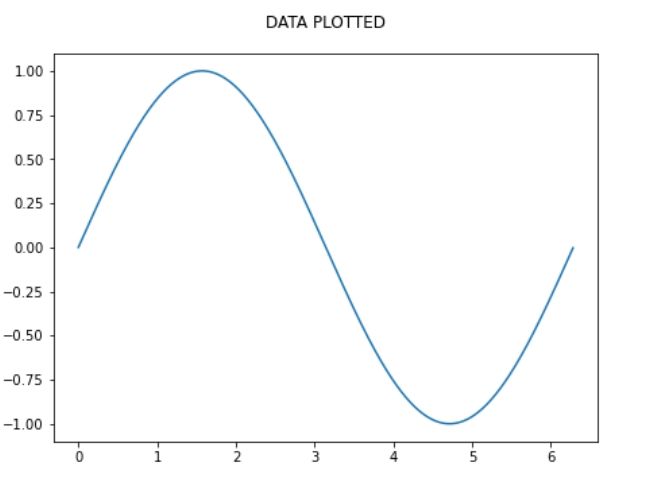
ht = np.arange(0, 2 * np.pi, 0.01)
base.plot(ht, np.sin(ht))
figr.set_size_inches(7, 5)
figr.suptitle("DATA PLOTTED")
mpl.show()
Output:
Explanation:
First, we have to import the matplotlib.pyplot module. We have also aliased it with the name ‘mpl’ using the as a keyword. Also, we have to import the figure and Numpy. Next, we will create the base and height (ht) with two collection of values. Then, we can use the plot() to figure it out. Check that, we have passed two values (ht and the sin(ht)) in the plot().
Now, to change the default size of the figure, we have called the set_size_inches() where we have passed 7 and 5. Lastly, we have displayed the plot with a title.
Method 4: Altering the default rcParams:
This is a unique way of changing the default size of the figure on a permanent basis. We can set our user-defined value as per our requirement by redefining the figure.figsize.
Syntax:
matplotlib.pyplot.rcParams['figure.figsize'] = [width_value, height_value]
Program:
import matplotlib.pyplot as mpl
# x-axis data
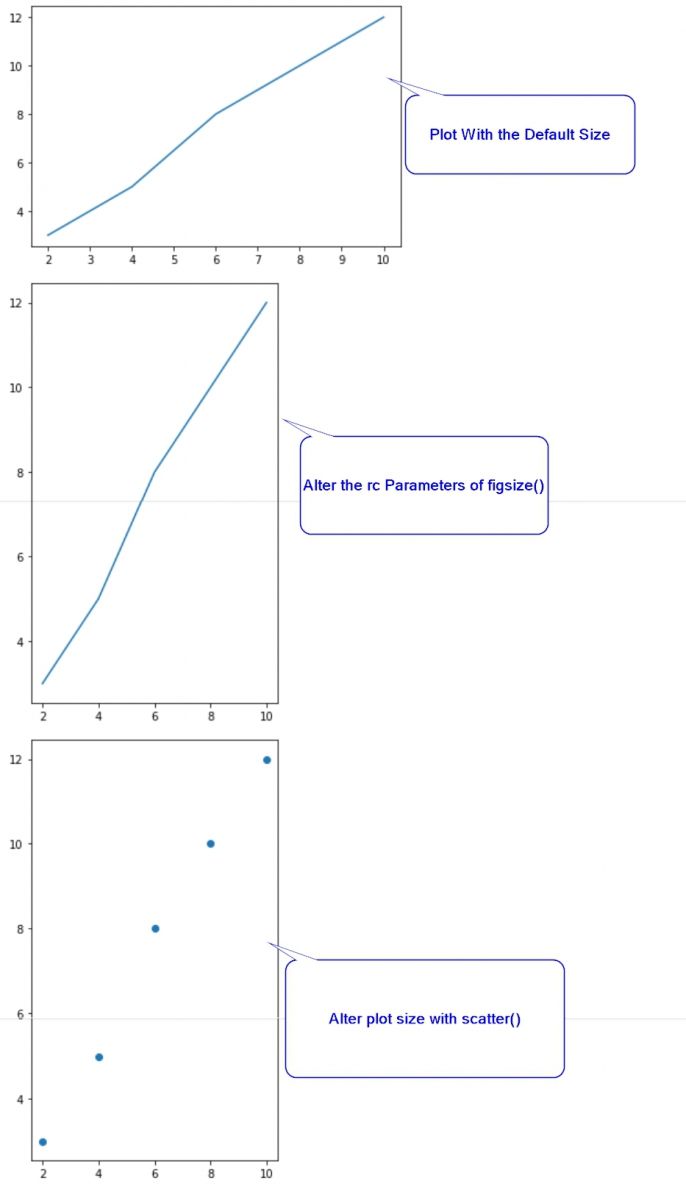
a = [2, 4, 6, 8, 10]
# y-axis data
b = [3, 5, 8, 10, 12]
# Plot with the default size
mpl.plot(a, b)
mpl.show()
# Alter the rc parameters of figsize()
mpl.rcParams['figure.figsize'] = [4, 7]
mpl.plot(a, b)
mpl.show()
# Alter plot size with scatter()
mpl.scatter(a, b)
mpl.show()
Output:
Explanation:
First, we have to import the matplotlib.pyplot module. We have also aliased it with the name ‘mpl’ using the as keyword. Next, we have to create the values of X and Y axes. In this program, we will go with the list data type to create the X and Y axis data. Next we plot() the data and show() them. Now if you use the rcParams['figure.figsize'], it will provide a unique way of changing the default size of the figure.
We can set our user-defined value depending as per our requirement. Here you will see three different charts, two line chart and one scatter chart, but the latter two have the different size (4x7).
Conclusion:
Among these four, the 'figsize' is the most popular one. It is convenient and simple to use. But, apart from that, method two takes two methods which make it complex and slow. set_size_inches() is another method that works faster than the set_figheight() and set_figwidth() methods.
But, if you are a data analyst who does not want to set the figure size in every plotted figure and wants the same figure size throughout the project, matplotlib.pyplot.rcParams[] is for you. Set it once as per your requirement and you won't have to worry about the figure size again within your project.
It might be costly if you use it for fewer plots since it takes internal changes in the code. Otherwise, it is the best technique for bulk plots.