In this document, you will learn how to create tables in Python, how to format them, and how parsing is useful. Python provides tabulate library to create tables and format them.
To install the tabulate library execute the below command on your system:
pip install tabulate
What is Tabulate Module?
This module helps in pretty-print tabular data in Python; a library that helps in providing better command-line utility. The main usages of the module are:
- printing miniature sized tables without hassle or formatting tools. It requires only one function call, nor another formatting requirement. This module can easily understand how to frame the table.
- composing tabular data for lightweight plain-text markup: numerous output forms appropriate for additional editing or transformation
- readable presentation of diverse textual and numeric data: configurable number formatting, smart column alignment, alignment by a decimal point
It leverages a method called the tabulate() that takes a list containing n nested lists to create n rows table.
Program:
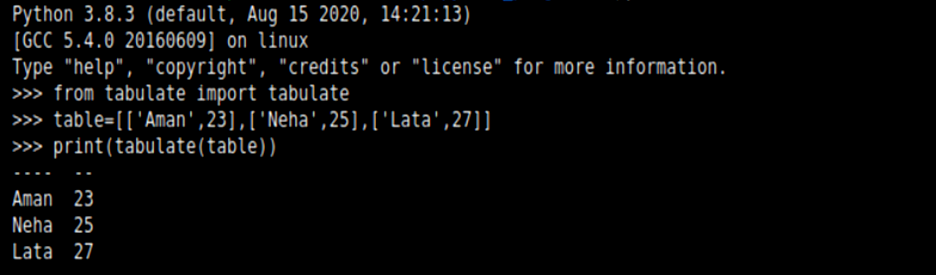
from tabulate import tabulate
table = [[‘Aman’, 23],[‘Neha’, 25],[‘Lata’, 27]]
print(tabulate(table))
Output:
Explanation:
Here we have used the module Tabulate that takes a list of lists (also known as a nested list) and stored it under the object name table. Then we use the tabulate() method where we passed the table object (nested list). This will automatically arrange the format in a tabular fashion.
Table Headers
To get headers or column headings you can use the second argument in tabulate() method as headers. For example,
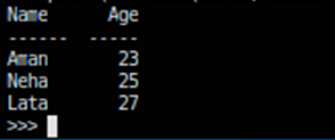
from tabulate import tabulate
table = [[‘Aman’, 23], [‘Neha’, 25], [‘Lata’, 27]]
print(tabulate(table), headers = [‘Name’, ‘Age’])
Explanation:
Here we have used the module Tabulate that takes a list of lists (also known as a nested list) and stored it under the object name table. Then we use the tabulate() method where we passed the ‘table’ object (nested list). This time we take another parameter headers that takes two string values ‘Name’ and ‘Age’ that will be the title of the columns. This will automatically arrange the format in a tabular fashion.
Output:
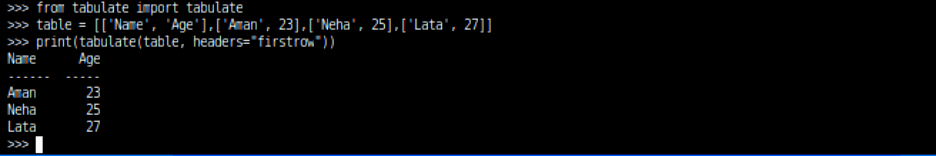
In the list of lists, you can assign the first list for column headers containing all column headings, and assign headers’ value as “firstrow”.
Example:
from tabulate import tabulate
table = [['Name', 'Age'], ['Aman', 23], ['Neha', 25], ['Lata', 27]]
print(tabulate(table, headers = "firstrow" ))
Output:
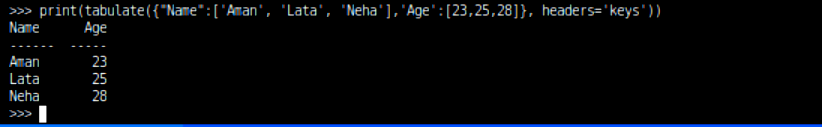
You can also pass a dictionary to tabulate() method where keys will be the column headings and assign headers’ value as “keys”.
Example:
from tabulate import tabulate
table = [['Name', 'Age'], ['Aman', 23], ['Neha', 25], ['Lata', 27]]
print(tabulate({"Name" : ['Aman', 'Lata', 'Neha'], 'Age' : [23, 25, 28]}, headers = 'keys'))
Output:
Row Index
You can display the index column containing indexes for all rows in the table.
Example:
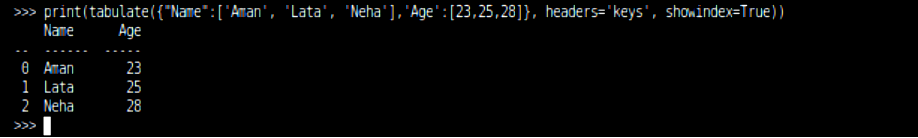
tabulate({"Name":['Aman', 'Lata', 'Neha'], 'Age': [23, 25, 28]}, headers = 'keys', showindex = True)
Output:
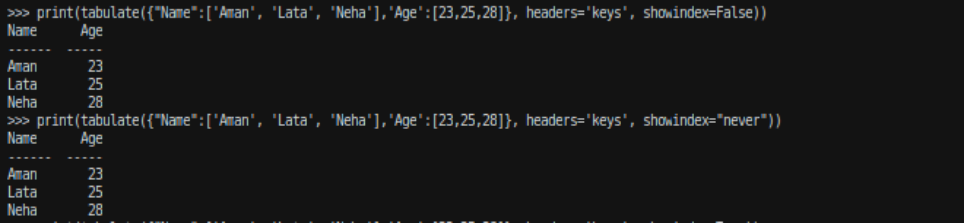
To hide the index column you can use showindex as ‘False’ or showindex as ‘never’.
Example:
tabulate({"Name":['Aman', 'Lata', 'Neha'], 'Age' : [23,25,28]}, headers = 'keys', showindex = "never")
and,
tabulate({"Name":['Aman', 'Lata', 'Neha'],'Age':[23,25,28]}, headers = 'keys', showindex = False)
Output:
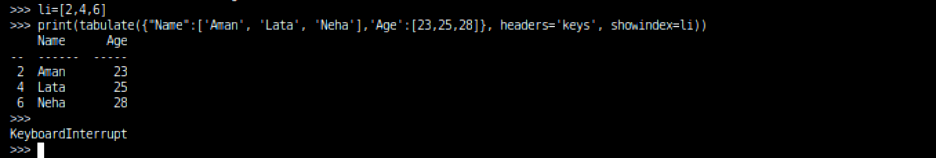
To have a custom index column, pass an iterable as the value of showindex argument.
Example:
li=[2,4,6]
tabulate({"Name":['Aman', 'Lata', 'Neha'],'Age':[23,25,28]}, headers = 'keys', showindex = li)
Output:
Number formatting
The tabulate() method allows you to display the specific count of numbers after a decimal point in a decimal number using floatfmt argument.
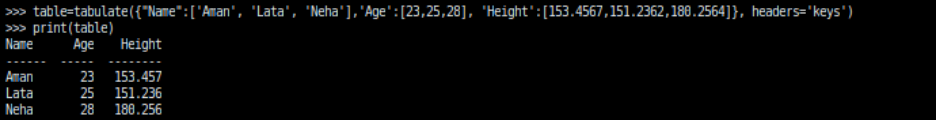
Example: Adding a new column Height in the above example:
table=tabulate({"Name":['Aman', 'Lata', 'Neha'],'Age':[23,25,28],'Height':[153.4567,151.2362,180.2564]}, headers='keys')
Output:
Formatting the height values up to two digits:
tabulate({"Name":['Aman', 'Lata', 'Neha'],'Age':[23,25,28], 'Height':[153.4567,151.2362,180.2564]}, headers='keys', floatfmt='.2f')
Output:
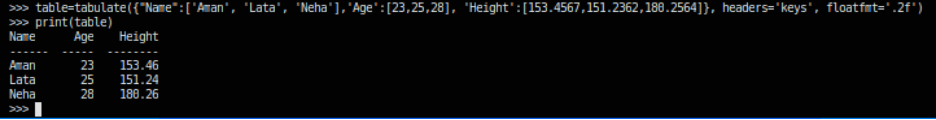
Table format
You can format the table in multiple ways using tablefmt argument. Following are a few of them:
- plain
- simple
- html
- jira
- psql
- github
- pretty
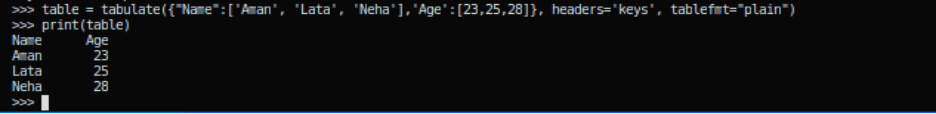
plain: It formats the table in a plain simple way without any outer lines:
Example:
tabulate({"Name":['Aman', 'Lata', 'Neha'],'Age':[23,25,28]}, headers='keys', tablefmt="plain")
Output:
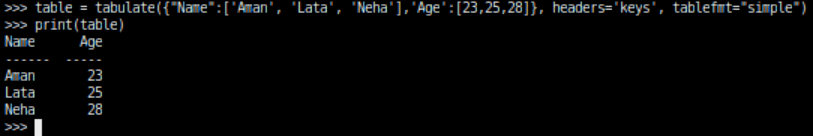
simple: It is the default formatting in tabulate() method that displays the table with one horizontal line below the headers:
Example:
tabulate({"Name":['Aman', 'Lata', 'Neha'],'Age':[23,25,28]}, headers='keys', tablefmt="simple")
Output:
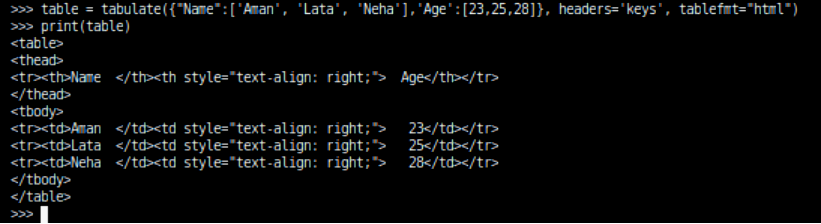
html: It displays the table in html code format:
Example:
tabulate({"Name":['Aman', 'Lata', 'Neha'],'Age':[23,25,28]}, headers='keys', tablefmt="html")
Output:
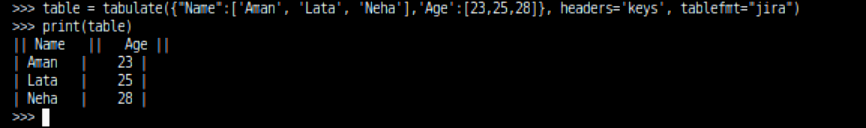
jira: Displays the table in Atlassian Jira markup language format:
Example:
tabulate({"Name":['Aman', 'Lata', 'Neha'],'Age':[23,25,28]}, headers = 'keys', tablefmt = "jira")
Output:
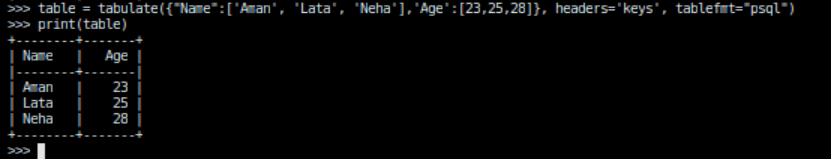
Psql: It displays the table in Postgres SQL form.
For example: tabulate({"Name":['Aman', 'Lata', 'Neha'],'Age':[23,25,28]}, headers='keys', tablefmt="psql")
Output:
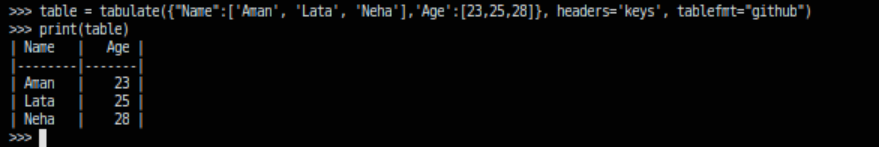
Github: It displays the table in GitHub mardown form.
For example: tabulate({"Name":['Aman', 'Lata', 'Neha'], 'Age':[23,25,28]}, headers = 'keys', tablefmt = "github")
Output:
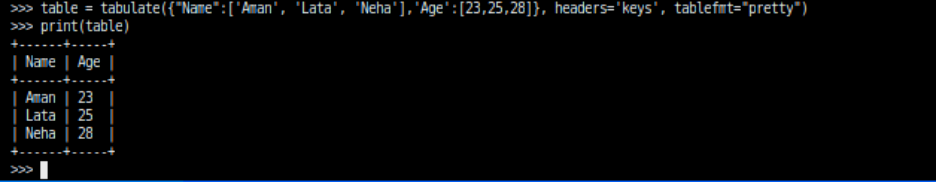
Pretty: Displays table in the form followed by PrettyTables library
For example: tabulate({"Name":['Aman', 'Lata', 'Neha'], 'Age':[23,25,28]}, headers='keys', tablefmt = "pretty")
Output:
PrettyTable Module:
PrettyTable is another Python library that helps in creating simple ASCII tables. It got inspired by the ASCII tables generated and implemented in the PostgreSQL shell psql. This library allows controlling many aspects of a table, such as the the alignment of text, width of the column padding, or the table border. Also it allows sorting data.
Creating a Table using Python:
Creating a table in Python is very easy using the PrettyPrint library. Simply import the module and use its add_row() method to add multiple rows or create a table row-wise.
Example:
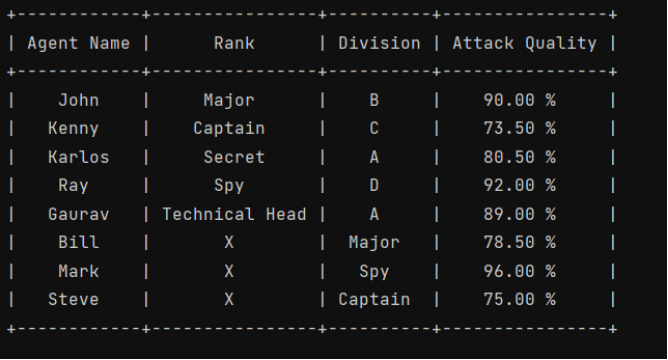
from prettytable import PrettyTable

myTab = PrettyTable(["Agent Name", "Rank", "Division", "Attack Quality"])
# Add rows
myTab.add_row(["John", "Major", "B", "90.00 %"])
myTab.add_row(["Kenny", "Captain", "C", "73.50 %"])
myTab.add_row(["Karlos", "Secret", "A", "80.50 %"])
myTab.add_row(["Ray", "Spy", "D", "92.00 %"])
myTab.add_row(["Gaurav", "Technical Head", "A", "89.00 %"])
myTab.add_row(["Bill", "X", "Major", "78.50 %"])
myTab.add_row(["Mark", "X", "Spy", "96.00 %"])
myTab.add_row(["Steve", "X", "Captain", "75.00 %"])
print(myTab)
Output:
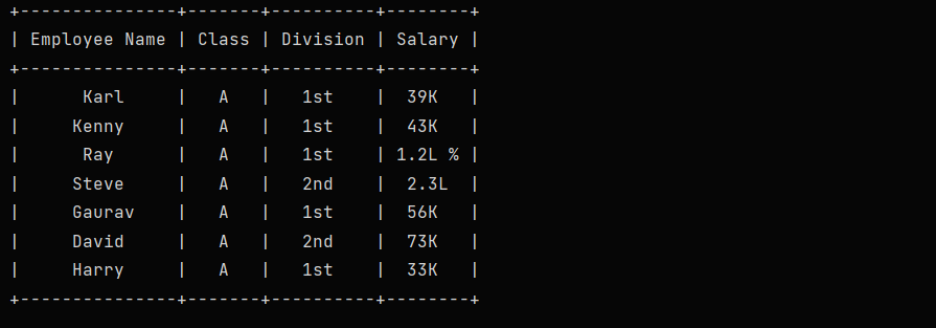
Example to create a table column-wise:
from prettytable import PrettyTable
columns = ["Employee Name", "Class", "Division", "Salary"]
myTab = PrettyTable()
# Add Columns
myTab.add_column(columns[0], ["Karl", "Kenny", "Ray", "Steve", "Gaurav", "David", "Harry"])
myTab.add_column(columns[1], ["A", "A", "A", "A", "A", "A", "A"])
myTab.add_column(columns[2], ["1st", "1st", "1st", "2nd", "1st", "2nd", "1st"])
myTab.add_column(columns[3], ["39K", "43K", "1.2L %", "2.3L", "56K", "73K", "33K"])
print(myTab)
Output:
Conclusion:
Table plays a significant role in software development where the developer wants to create a formatted output. A lot of CLI-based software requires such formatting. Formatting through tabular form also helps in giving a crisp idea of the data so that the users can easily understand what the data wants to convey. Both these modules work well for representing data in tabular format. Web development using Python also requires these modules.