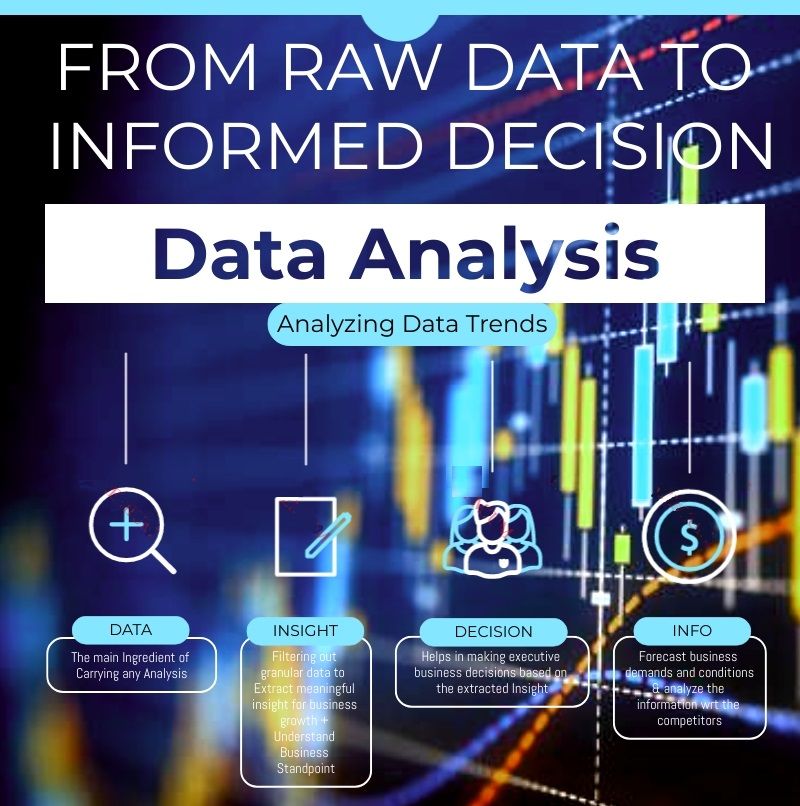
Data has now become a critical source to leverage critical competitive advantage in most firms. Enterprises are focusing more on granular data to seeking newer techniques to identify & analyze the data for extracting better insight. There are two different aspects and phases of extracting insight from data. These are data analysis and data visualization. In this article, you will learn the differences between data analysis and data visualization.
Definition:
Data analysis:
is the technique of examining structured and unstructured data sets for extracting valuable and meaningful insight from the data set. Various organizations use data analysis algorithms in different domains such as business, healthcare, innovation, AI, etc.
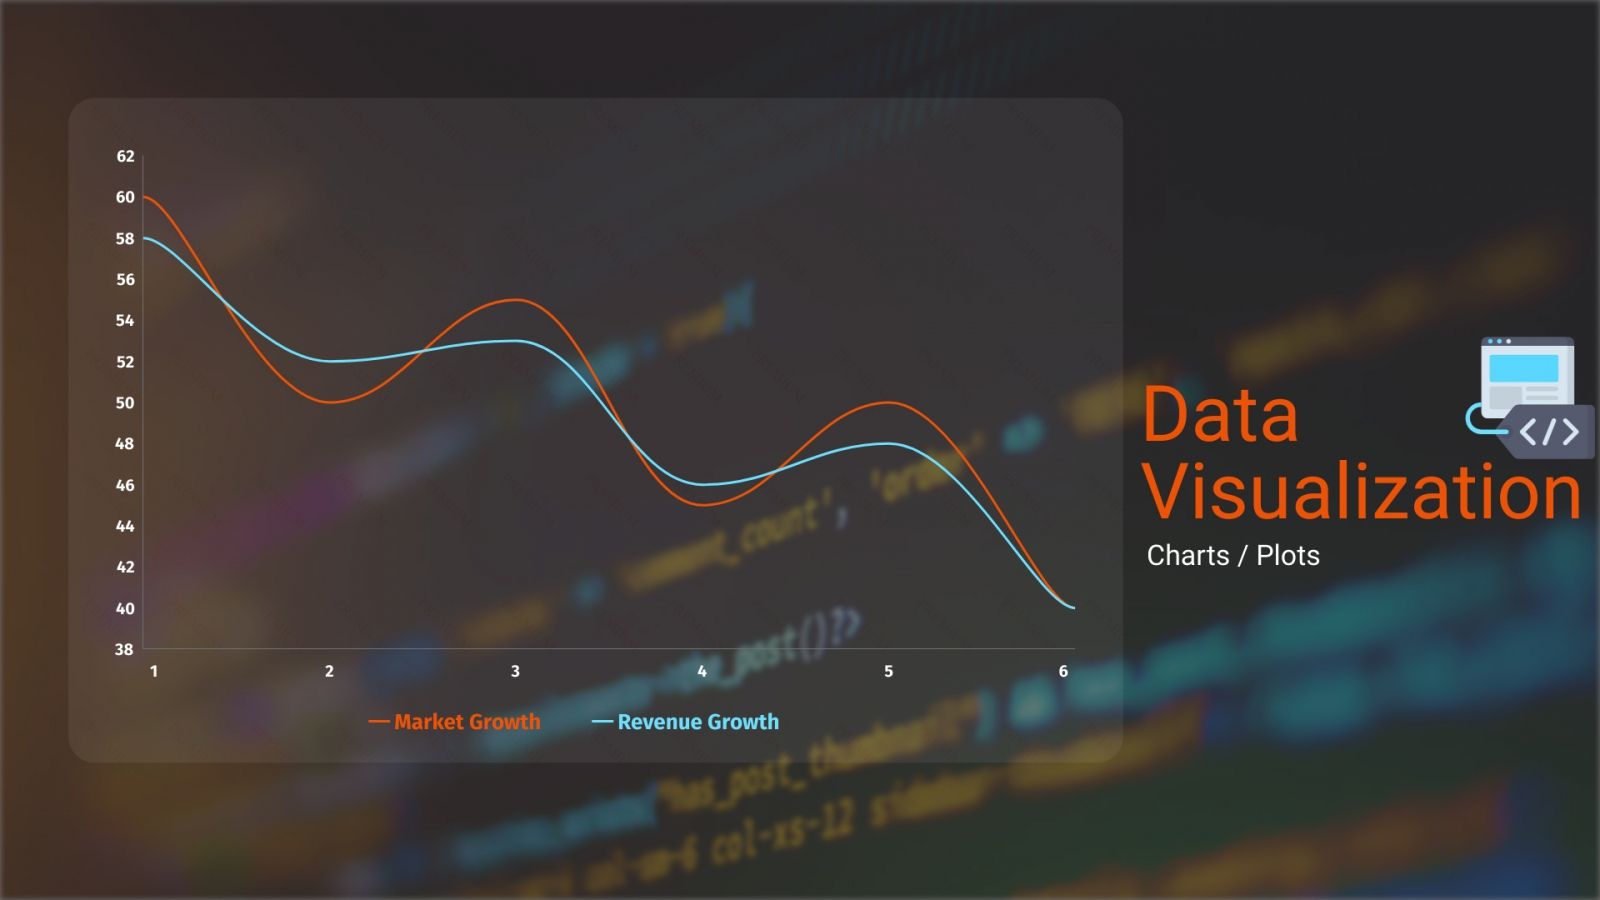
Data visualization:
is the technique of visualizing analyzed data in processed visual form.It represents the data in various forms like lists, maps, charts, graphs, etc. This graphical representation helps in describing the actual magnitude of the data.
Data Analysis vs. Visualization:
| Data Analysis | DataVisualization |
|---|---|
| Data analysis is the process of analyzing data sets to extract meaningful insight. | Data visualization is the graphical representation of data when extracted into meaningful form. |
| Data analysis is always the initial process of extracting meaning out of raw data clusters. | Data visualization phase comes right after data analysis where the meaningful data gets processed. |
| Helps in identifying the underlying patterns and models | Helps in identifying the areas and domains where prior attention for improvement is needed |
| Data analysis acts as an input for the next phase i.e., data visualization | Data visualization acts as an input for the next phase i.e., data-driven decision making |
| Data analysis contains techniques for prescriptive, predictive, and diagnostic analysis. | Data visualization can be either interactive or static in type. |
| The goal is to help businesses through data-driven insights. | The goal is to help communicate information sharply and effectively to get more visual meaning. |
| The data analysis phase is popular in industries like commercial, business, management, crime detection, travel agencies, etc. | The data visualization phase is popular in banking, healthcare, retailing, marketing, sales, etc. |
| Data is usually taken from data warehouses, data repositories, or databases for further analysis. | Processed data or data turned into meaningful insight is taken further for visualization. |
| Top data analysis tools, libraries, and languages are SAS, Spark, Excel, RapidMiner, Python, R, etc. | Top data visualization tools and libraries are Tableau, QlikView, Plotly, Seaborn, Matplotlib, etc. |
| This helps in identifying the gaps, outliers, trends, and interesting data points that requires further investigation. | This helps in identifying the visual elements ranging in value from single charts to comprehensive dashboards. |
| It helps in prediction and decision-making. | This helps in creating data story or infographics. |
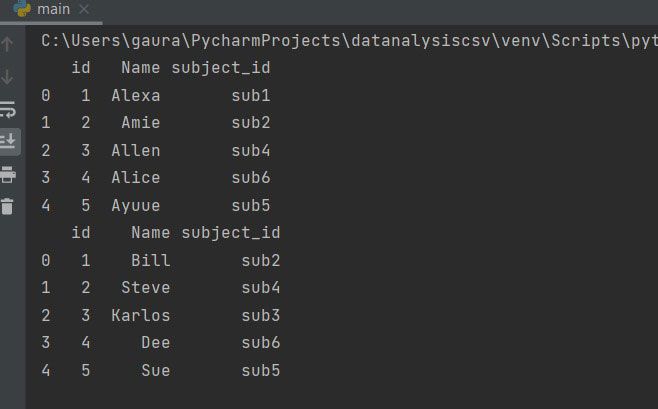
Data analysis Program:
import pandas as pd
left = pd.DataFrame({
         'id':[1,2,3,4,5],
         'Name': ['Alexa', 'Amie', 'Allen', 'Alice', 'Ayuue'],
         'subject_id':['sub1', 'sub2', 'sub4', 'sub6', 'sub5']})
right = pd.DataFrame(
         {'id':[1,2,3,4,5],
         'Name': ['Bill', 'Steve', 'Karlos', 'Dee', 'Sue'],
         'subject_id':['sub2', 'sub4', 'sub3', 'sub6', 'sub5']})
print(left)
print(right)
Output:
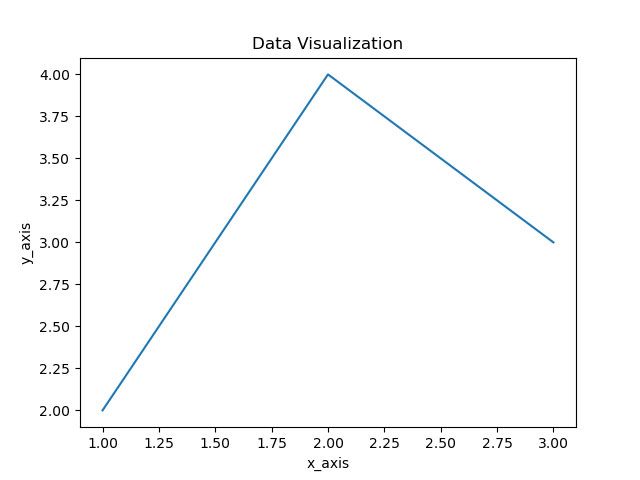
Data Visualization Program:
import matplotlib.pyplot as mpl
a=[1,2,]
b=[2,4,3]
mpl.plot(a,b)
mpl.xlabel('x_axis')
mpl.ylabel('y_axis')
mpl.title('Data Visualization')
mpl.show()
Output:
Conclusion:
When it comes to the need for data analysis and visualization, both of them come in conjunction. Industries and enterprises require both of them together to understand the raw data and fetch out meaningful insight from it. This way, decision-makers and enterprise executives can make better decisions or can take prompt actions based on the granular data insights extracted through these processes.