There are different modules in Python that allow programmers to measure the statistics of a Python program. Doing this helps users know where the program is consuming too much time.
They can optimize their code according to the program requirement if they are well-known for the time consumption of each line of code. It is always preferable for programmers to optimize their code to increase the efficiency of their Python program.
Performing some standard Python tests and using some standard modules can ensure the best optimization of the overall Python program. This article will discuss how to profile a Python program and know where the program is consuming too much time.
What is known as profiling in Python?
To check where the program is taking more time for the execution and ensure the coding efficiency brings into the action of profiling a Python code. Profiling Python program also increases the efficiency of the code.
A profile is a collection of statistical methods and modules that defines how often and for how long the different sections of the program are taking time to execute. Then, according to the statistics, users can convert them into reports through the statistical module.
The Profile Module of Python:
Using a small Python code and focusing on a particular statement becomes easy as it is a microscopic perspective. But difficulties arise when users deal with large and complex Python programs.
When a programmer wants to see what is causing the program to run slowly, it becomes a matter which is hard to find and understand. Generally, a program slowly runs when it has any of these two cases or both - a part of the program runs slow or multiple times, adding up and consuming too much time.
These are "performance hogs" or the hot spot.
In Python, some modules help in profiling the Python program. These are:
- Time module
- Target profiling
In Python, there are standard libraries like time and cProfiler that helps to implement profiling interface. Using these techniques, we will create a Python program and optimize our code according to the statistical report.
The article discusses these methods as follows:
Method 1: Using the Python time module to profile Python code:
Users can use the time module to calculate the statistics of the Python program. It is easy to implement, and users can use it anywhere in the Python code to measure time consumption.
Here, the module includes timers that help get the exact time consumed by the program during the execution. It improves the overall performance of the code. The time module provides the methods to profile the program.
The time module comes with the standard utility module of Python. So, programmers do not need to install the library externally.
Example 1: Using the time module:
Code Snippet:
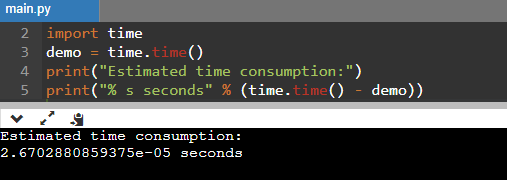
# importing time module
import time
demo = time.time()
print("Estimated time consumption:")
print("% s seconds" % (time.time() - demo))
Output:
Explanation:
Here, the time module uses a timer and counts the time consumed by the program. Here, we print the time in seconds by subtracting the time.time() module from the line of code having the variable "demo."
Example 2: Using the Python time module:
Code Snippet:
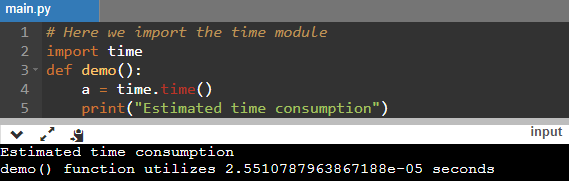
# Here we import the time module
import time
def demo():
	a = time.time()
	print("Estimated time consumption")
	b = time.time()
	print("demo() function utilizes", b-a, "seconds")
# Here we call the demo function
demo()
Output:
Explanation:
We are using the time module to measure the time consumed by the program to call the "demo" function and print the statement. The variable "a" is the start variable and the "b" is the end. So, in the print() function, we subtract the start from the end to get the time consumption of the function "demo."
Method 2: Using the Python cProfiler to check and calculate the time consumption of the program:
Python provides this built-in module named cProfiler, which calculates the execution time of the overall Python program. Experts and professionals recommend this module as users can easily format the reports as a pstats module. cProfile's profiling interface helps users to implement development easier.
Python cProfile is a collection of numbers that displays how long and often a program section consumes time to call and execute. The execution of the cProfile module is relatively easier than the time module, which is the first method of this article.
The cProfile module provides all details about the time consumption of the overall Python program, including the number of times users call the function in the code.
Example 1:
Code Snippet:
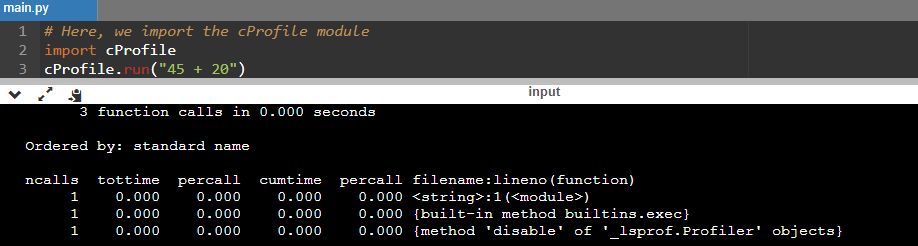
# Here, we import the cProfile module
import cProfile
cProfile.run("45 + 20")
Output:
Explanation:
It is the most basic and effective way of profiling a Python program with the cProfile module. Here we used the run() function and passed a string statement to run(). It returns all the details regarding the time consumed by the program, as we can see in the output console.
Example 2: Using the cProfile() to measure the time consumption:
Code Snippet:
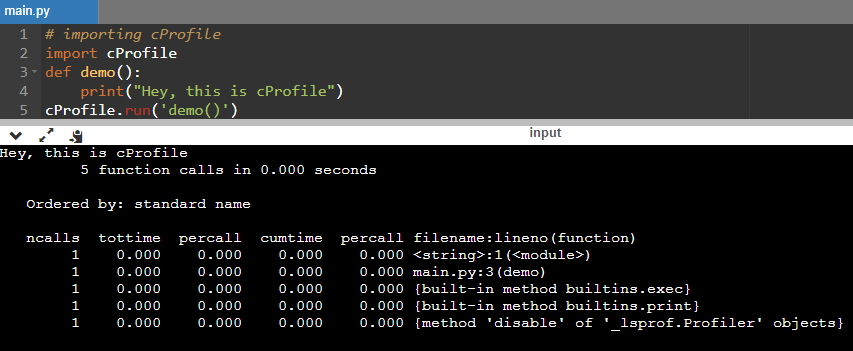
# importing cProfile
import cProfile
def demo():
	print("Hey, this is cProfile")
cProfile.run('demo()')
Output:
Explanation:
Here, we used the same module cProfile that measures and gets the statistics of the time consumption of the function named "demo."
Example 3: Here we used the cProfile module with other Profile class:
Code Snippet:
# importing library
import cProfile
import io
import pstats
from pstats import SortKey
# Here, we create a profile object
a = cProfile.Profile()
a.enable()
sample = 20**800000
a.disable()
sec = io.StringIO()
demo = SortKey.CUMULATIVE
b = pstats.Stats(a, stream=sec).sort_stats(demo)
b.print_stats()
print(sec.getvalue())
Output:
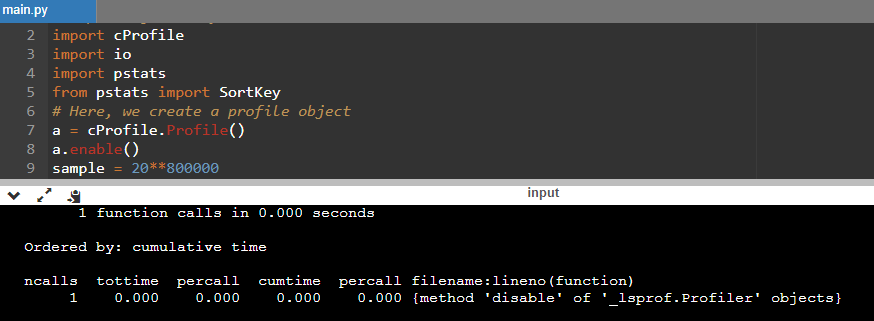
Explanation:
In the above code example, we used the Profile class over the cProfile.run() function. The time consumed will increase as we increase the power according to the user's machine efficiency.
The getvalue() function returns the overall content of the program.
Why do we need Python Profilers?
Every programmer wants to make their program consume the lowest computational time and cost. So to make code more efficient and fast, programmers must know which part of the code takes how much time.
It allows them to focus on that particular part and attain efficiency.
Conclusion:
We hope this article has catered to all the methods of profiling a Python program. We have used two standard modules of Python profiling, named time and cProfile, to measure the time consumption of the program with the following examples of code.