What common symptoms can occur if there is a problem when indexing data from SAP NetWeaver BW to SAP NetWeaver BW Accelerator?
Listed below are some of the common symptoms that may occur if there is a problem when indexing data from SAP NetWeaver BW to SAP NetWeaver BW Accelerator
- Failure of the indexing process
- Termination of parallel indexing process
- Crashing of the TREXIndexServer
- On a specific blade there is high CPU load
- A user can get following errors: "Join index create error," "The index is temporary not available," when running queries.
How can I get this issue fixed?
In order to eliminate the possibility of networking and hardware problems, few checks should be performed:
The hardware configuration, as well as the I/O for each blade and the network settings between BW and BWA should be checked.
a. The storage should be checked
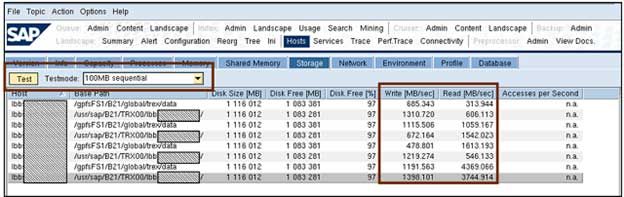
In the Read / Write column, if the individual values between each other differ too much, this can be an indication of possible network problems in the System Landscape.
b. The Application Servers should be pinged.
- If there is a considerable delay between the application servers, the network connection between the BW application server and the BWA server should be checked as a part of the investigation schedule.
- For a package size of 65,000 bytes, the ping time should be below 2.5 ms as recommended.
- Furthermore, between the BWA and the BW application servers, there should not be more than one hop.
- By using the following command, the values can be measured:
/usr/sap/<sid>/TRX00>ping -s 65000 -c 10 <BW server>
Possible Solution: Re-index without the slower application server and observe the results, if the network speed between BWA and a specific application server is low.
c. Hosts Network
From the Trex Administration tool - Hosts -> Network tab, the inter-blade communication can be checked.
The speed with which the blades communicate and interchange data can be seen here.
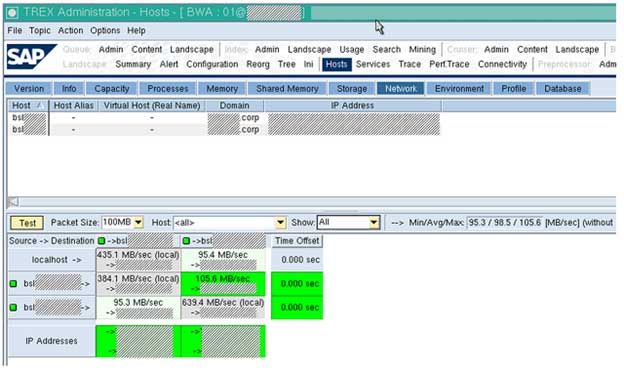
The can be a problem with the network if the values are under 80 Mb/s. From the TREXAdmin tool in Hosts -> Network, this can be seen.
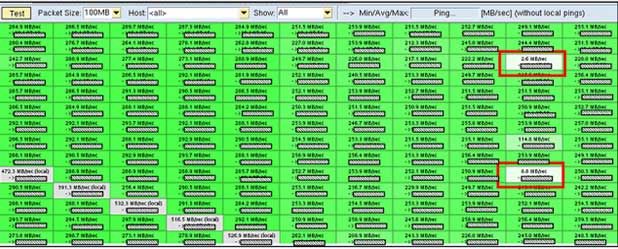
Possible Solution: Some entries in Figure 3: TREX Python Tool, Hosts->Network. A bad connection between the blades is shown in the interblade connection test which is way under 80 Mb/s. This may indicate network issues. The cause for problems at indexing may be due to this network issues. In this case, the hardware partner should be notified to have a look.
d. Connectivity:
The numbers of threads should be checked if they are sufficient / adapted automatically
The number of threads can be adapted automatically with the help of the BW Accelerator configuration. In the case of heavy parallel indexing, this is especially important.
One can get error messages about broken RFC communication, if there are inadequate threads in the TREXRfcServer during phases of high load, for handling the requests from BW.
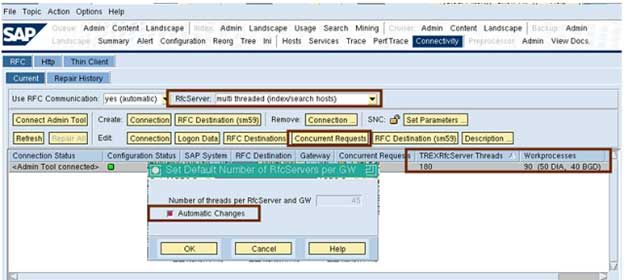
The BW Accelerator tries to start twice as many RFC server threads on the BW system (total of all application servers) as there are work processes (DIA plus BGD) if the “Automatic Changes” indicator is selected. However, this could create some problems where the indexing is completed via RFC, rather than ICM especially in BWA version 700, if the automatic changes are not activated.
Possible solution:
The RFCServer Threads’ automatic adaption should be set. By following the below given steps, this can be enabled:
- Select “Connect Admin Tool”
- Now, choose the line of the RFC Destination to the BW System
- Then the "Concurrent Requests" tab should be clicked.
- Set the "Automatic Changes" in the pop-up window.
- With the next execution of the AlertServer check "RFC_CHECK", the concurrent requests will be adjusted. In check_set hpa_2, this is normally scheduled every 11 minutes.
Note: The RFC server must be set to multi-threaded and it should be noted. On every BWA node/blade, an RFC server runs.
Investigate the job Logs
The job log in transaction SM37 shows if jobs have been filed that are related to the indexing.
The following jobs / application logs or for other jobs that were running at the time of indexing can be searched depending on the situation:
Creation of Index in RSDDB
Job name: BW_TR_RSDDB_BIAINDEX_FILL – Indexing in RSDDB
Job name: BITRP_* – Children of filling job (for parallel filling)
Deletion of Index in RSDDB
Application Log: Object: RSDDTREX / Subobject: TAGGRFILL / External Identifier: BIA_DELETE_<InfoProvider> – Delete BIA Index
Creation of Master Data Index
Job name: BW_TR_RSDDB_BIAINDEX_FILL – Indexing in RSDDB
Master Data Daemon
Job name: BI_BIA_NEWMD_INDEX – Master Data Daemon
Master Data Indexes -Deletion
Job name: BI_BIA_MD_INDEX_DELETION – Delete Master Data (Garbage Collector)
Check the application log – transaction RSDDB / alternatively SLG1
Check the Application log by going to transaction RSDDV (in BWA 700) / RSDDB (in BWA 7.20) where some details are listed. Restrain your search to it, if you know which InfoCube has created problems.
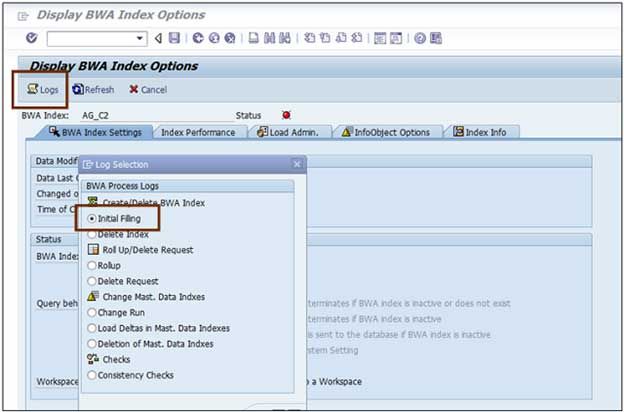
Go to the application logs post selecting the BIA Index.
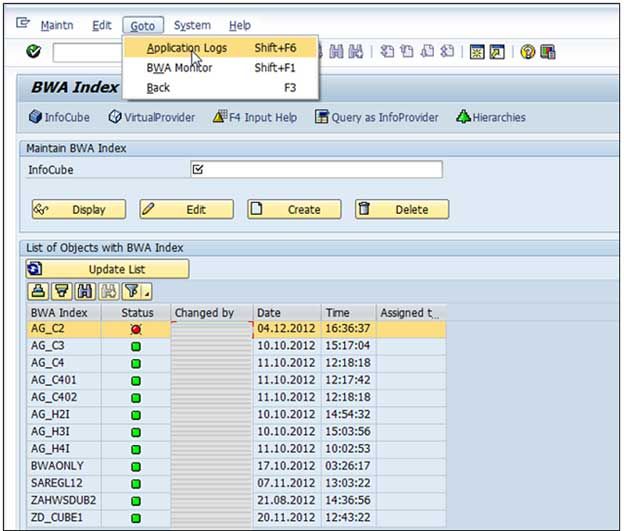
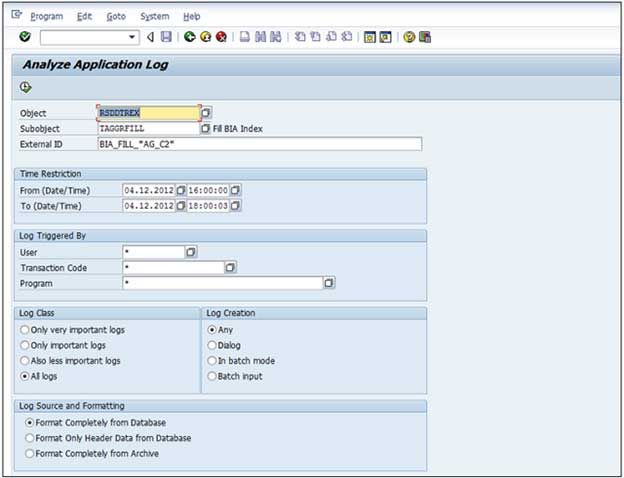
Go to Logs and select RSDDTREX as "object" and TAGGRFILL as "Subobject", if the problem you are investigating is related to the initial filling for example.
Restrictions should be maintained to the indexing timeframe, if possible.
a) The application log findings - Example 1
In the application log files, here is an example of an error: "Error occurred during serialization," during S-table indexing "Parallel indexing process terminated", as mentioned in the below given picture:
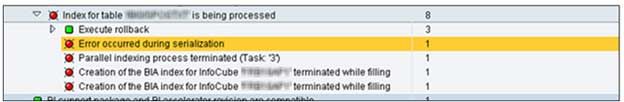
If a value is inconsistent or not it should be noted, that it cannot be read from the application log directly.
Possible Solution
The invalid character should be removed from the S-table.
Remove any single byte characters from the data when using Non-Unicode system and if the system code page is configured to use double byte characters.
This is because during a serialization, the system identifies a single byte character as a broken double byte character. You need a unicode system (Please read SAP 73606 for details regarding SAP language/code page configuration) when using double byte characters and single byte characters (special character like in Latin I, ISO 8859-1),
Workaround
Upload data into BWA via RFC instead of via ICM if you do not know which character represents a problem but want to upload data on an urgent basis. However, using RFC the data load is slower than via ICM.
As per SAP 1091088, a report RSDDTREX_ADMIN_MAINTAIN in SE38 and set STAB_CONVERT = X (in case the problem occurs in S table) should be executed in RSDDTREXADMIN table.
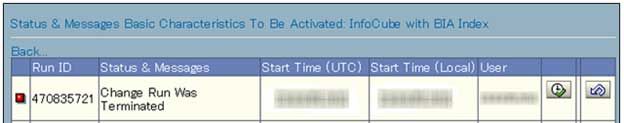
b) Application log findings- Example 2
The below given picture displays the application log the case where a job was cancelled. Due to a terminated change-run, the job was cancelled.
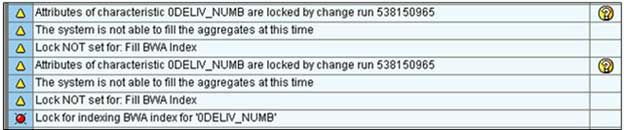
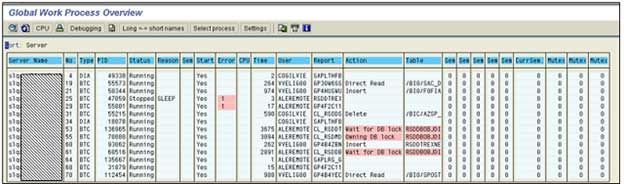
For instance, one can also see if two change-runs are locking each other in the Global Work Process Overview.
Possible solution:
When two related objects had change-runs executed at the same time, the deadlocks occur. Two things can be done in this situation:
1. Check if the terminated change-run exists as mentioned in the application log after going to transaction CHANGERUNMONI as shown in Figure 11: Change-run in transaction CHANGERUNMONI.
Execute the terminated change-run again first, if it exists. Restart the BWA job, when the change-run is completed.
2. A BWA job should not be executed while a change-run that changes an object that you want to fill o rollup to BWA is running.
Check if a service was recently started in Services -> Services
A BWA server can crash, in case of a severe error. However,the TREXDaemon re-starts any missing service immediately; due to which it is not always easy to see this.
Look at the Tab Services –> Tell if a service has been started recently by looking at the Services. “Start Time” is the column that shows this. This possibly means that the respective service has been crashed and has been restarted by the Daemon automatically. Look in the trace files to get a closer look (See Step 6 Trace files Analysis)) or (See: Step 7 Check the core files) in the core files).
Check the following things:
if there is a high load
if this is balanced on all blades or
if it only happens on a specific blade
a. Services - Threads
Under Services -> Threads, in the TREXAdmin python tool, all threads that receive data from BW can be seen. If most of or all the threads run on one host only should be checked as this causes high CPU load. Refer to SAP 1799735 for additional details.
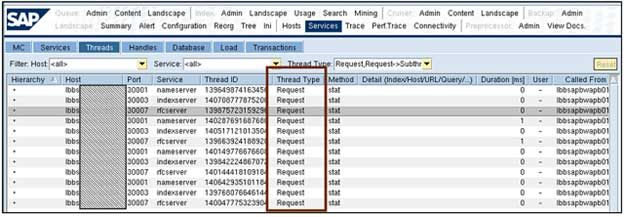
It can indicate that that the blade is short on threads if no thread has the status “waiting” in Services -> Threads tab, column: Thread Type. It can indicate that there is something wrong with the thread if for a specific thread in the RFC server or the IndexServer (when loading with ICM) the duration is very long (say, more than 30 minutes).
Possible Solution:
Restart the RFC server to get rid of a long running thread as there is no alternate way of terminating just one single thread.
Look at the RFCServer trace file first (see Step 6 Trace files Analysis)) before this.
b. Services - Load : if CPU / memory load is high, it should be checked.
To see if the CPU load is also very high, select a specific blade.
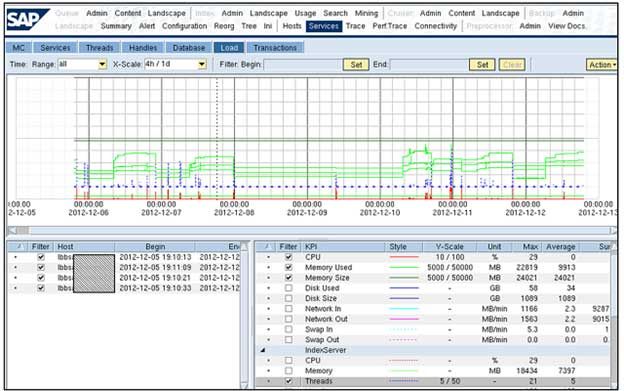
During the index filling, if you want to watch the load on the system, look for Services -> Load place.
Check the Tab Reorg in the TREX Admin Python Tool to see the index distribution, if you suspect that a specific blade is overloaded due to the fact that an index was not split and it put on that blade.
Possible Solution:
It might be that an index was not split, if there is a high load on one blade only. The cause for this can be most likely the one index which was not split has come from a very large InfoProvider. Due to this, it gets overloaded as BW sends all data packages to only one blade.
Some proposed actions are given below:
- First, the index should be tried to be rebuild, and it should be spitted manually if this does not work.
- A re-indexing might be required if the problem has caused some inconsistencies.
- If the split threshold was raised to a very high level, this can cause the index not to split. The value should be lowered (the default value is 100 millions).
- If the parameter initialReorg is turned off, this can cause the index not to get split. A typical case is when running report RSDDTREX_SINGLE_TABLE_INDEX the parameter needs to be switched off, so one should set it back to one afterwards without forgetting.
Trace files Analysis
For the trace files analysis, the following services are relevant: Indexserver, RFC server and NameServer.
The trace file is created by every server /service. To restart the other services, the TREXDaemon is responsible.
Some lines get written into the Daemons trace file, in case they crash. In the trace file, the crashed service cannot still write on its own.
If for instance, look at the TREXDaemon trace file, if the IndexServer crashed while having a problem with an index. This provides information about the crashing process and about its restart. In addition, the TREXIndexServer trace file can be used to get information about the process after it has been resumed and is running again.
For example, use following commands, if you know the time span and you want to analyze and blade the index or index part
To change into the directory the trace resides:
/usr/sap/<SID>/TRX<id>> cd <blade_name>/trace
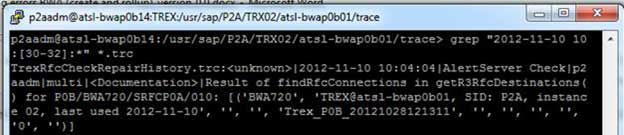
Say, for example, you can have a look at the trace files in the below mentioned time period if error has occurred on 11/10/2012 between 10:30 and 10:32:
/usr/sap/<SID>/<blade_name>/trace> grep "2012-11-10 10:[30-32]:*" *.trc
In the trace files, search for specific entries:
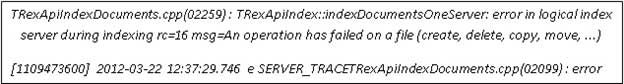
The TREXIndexServer trace file excerpt may indicate issues with the file system
An entry like this could indicate a hardware problem as the file system has issues when a rollup is executed.
Possible solution:
The hardware partner should be contacted.
Go to the TREXAdmin python tool in tab Trace as this is another way out. There in order to filter through the traces and to perform detailed trace analysis you can either
- Open the trace file by double-clicking it
- Do a quick search
- The Trace Analyzer tool should be used (Analyze button on the Trace tab).
TREX Admin Python Tool, Trace
General remarks about trace file analysis:
To analyze errors trace files are used as they are a very powerful tool; however, the solution may not be shown by the trace lines always.
It is recommended that for more information SAP Notes should be searched. A very useful search term can be provided by an error number or error text.
On component BC-TRX*, search for SAP Notes.
Reproduce the error as it may be useful for increasing the trace level and then for reproducing the issue. The trace files will get very big; therefore, this should be done with care. Raise certain components only, not to “debug” and/or raise to “Info” and/or trace for a very short time interval (e.g. 30 seconds).
Time intervals are usually involved in the trace file analysis. Often there is a need to compare the time stamps in BW traces (e.g. SM37).
The system times of BW and the BWA must be in sync for this. Please see 1755079.
It is very easy to download trace files to the local PC in transaction TREXADMIN. For the analysis of large trace files, the text editor of the personal choice can be used.
Check the core Files
In order to get a hint on what lead to a crash, the core files are usually investigated. For example, in code or a certain InfoCube a specific place.
A core file will be generated, if a process crashes and the core files on the system are activated. The alert server issues a warning when the core files are generated. In the Alerts tab in the TREX Python tool or on the ABAP side in the trexadmin transaction this can be seen.
Note: An entry in the TREXDaemon.ini file, can enable (or disable) the generation of core files. See 1553477 for details.
While having the core file activated on the system, if a process crashes or is killed, it will take more time. Even when the service restarts, the same thing will happen.
Some administrators choose to disable core files generation as this means downtime for the system.
For any process that crashes, the core files are generated and are located on the BWA blades, in folder /usr/sap/<SID>/TRX<id>/<blade_name>
They are titled as core.<pid> or <pid>.core, where <pid> denotes the process id for the crashed process.
Use the Linux command: >ls -lrt <directory_name> to display all files sorted by date.
Use the gdb debugger for reading the core files. The following Linux command can be executed to launch it:
>gdb usr/sap/<SID>/TRX<id>/exe/TREX*.x <corefile_name>
When the core file was created, have a look at which version the system was on, as it might be helpful.
Further analysis from SAP Support might be possible with this.
The Python Trace should be checked.
To reproduce an issue, the Python trace can be used.
Note: In order to reproduce actions that took place in the system, the python trace can be replayed. It is similar to RSTT trace on the BW side. It can be copied to another system and replayed there for analysis as it is revision independent. The trace can point to the root cause of the problem, if a Python trace is recorded and can be reproduced in another system. A python trace can split or can be replayed sequentially and then run in parallel.
Refer to the below given screenshot which explains for a specific query execution how a Python trace should be recorded.
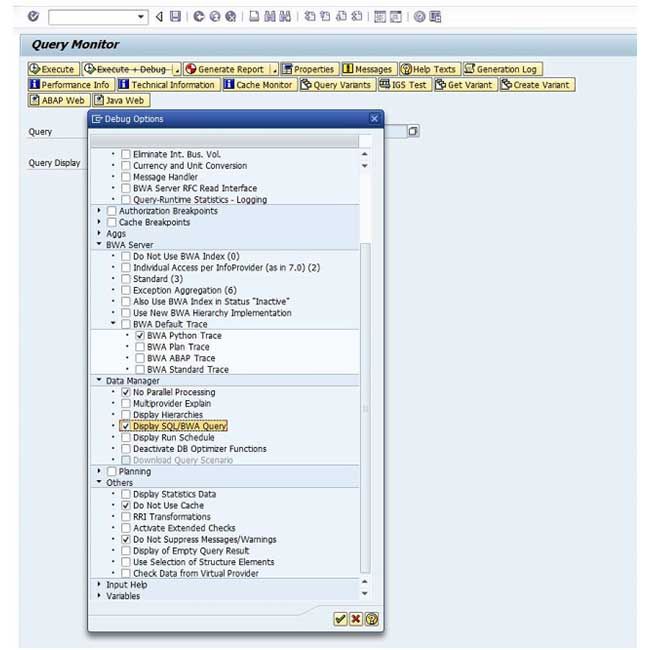
How to record a python trace
Switch on the Python trace for a period of time and run query candidates and see if a crash occurs, if the query that returns indexing errors is not known.
From the Python TREX Admin Tool, in the tab Trace, the Python trace can be switched on and switched off. In a trace file on the file system the trace is stored. Then run and analyze the recorded Python trace with the following Linux command:
>python <tracefile_name.py>
The communication method should be changed first, if the Python trace is running on a test system. Change the setCommunicationMethod parameter in the *.py file from zero to one in order to do this. Please note that even after running the Python trace the problem might not be reproducible there. This is due to the different BWA data on the test system.
Add the following code to the end of the trace to write the Python trace execution results to the command-line
: so.olapSearch() ->fuzzypy.writeResult(so.olapSearch())
Check the /var/log/ messages
If there is a problem on OS level on the blade an index resides, check the /var/log messages to see. For example, if the Linux OS has killed a process (for example the TREXIndexServer) can be seen from these messages. If a process exceeds the predefined parameters for system resource consumption, this can happen. To understand this trace, some knowledge about Linux is required. In order to access these files, a user needs root authorization.
Create an SAP Customer Message on component BC-TRX-BIA for further analysis, if all the proposed steps are checked and the problem still persists.