How To Start SQL Trace Analysis
Summary
SQL Trace is a performance analysis tool that shows how open SQL statements are converted into native SQL statements. The following document discusses the performance measure the utility of SAP SQL Trace Analysis (Transaction code ST05).
Please follow the steps in order to perform an SQL Trace:
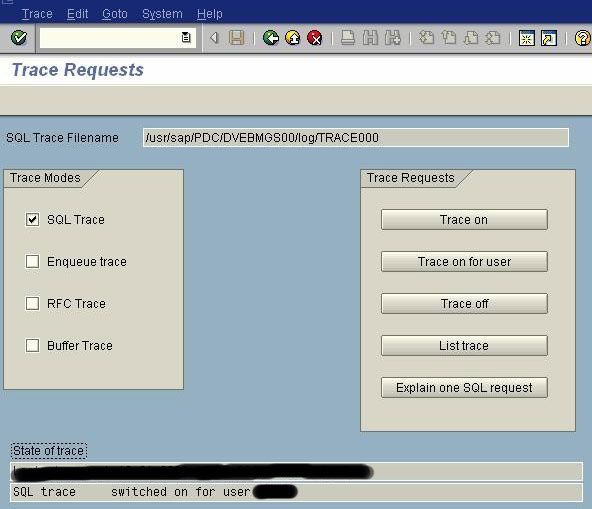
Step 1: Access transaction ST05. From the initial screen, click the check box for SQL trace, under the trace requests, click Trace on.
Step 2: Run the program containing the SQL query that needs to be analyzed in the SE38 editor.
Step 3: Come back to ST05 screen, under Trace requests, click Trace off.
Step 4: Click List trace to view the trace of the current statement.
Screen shot of the initial ST05 screen
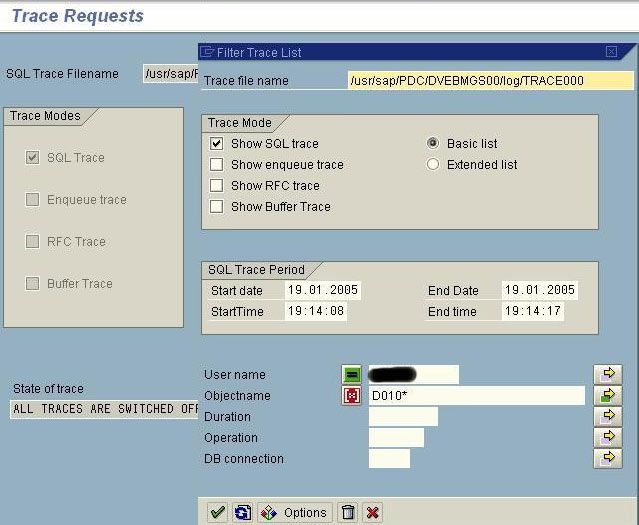
After clicking list trace
Basic List Trace
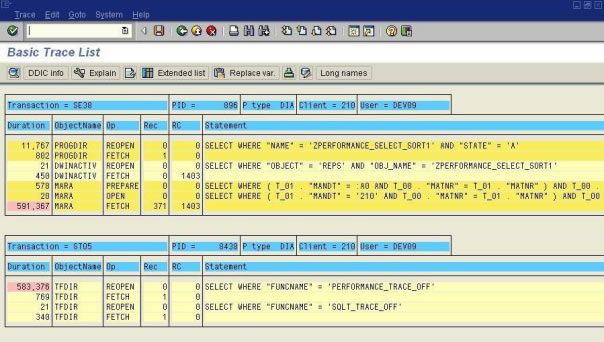
The basic list trace shows the sequence of database operations that are taking place while a query is processed, it includes prepare, fetches, open, reopen, execute. In addition the basic list trace also gives the duration execution for each of the operations with colour legend.
Summarizing the basic trace list (menu path: Goto Summary)
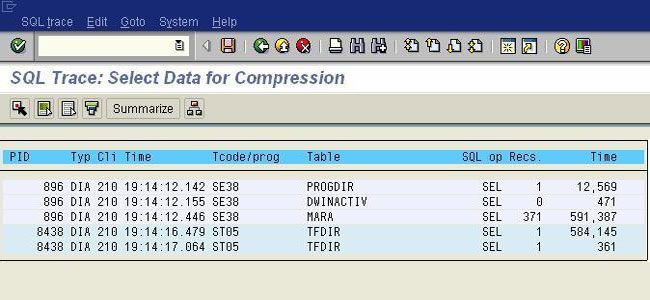
A basic trace list can be summarized to see the summation of execution times of similar database operations. Use menu path: Goto€Summary. The above screen shot depicts the summed up execution time. The summary option lists the summed up execution time of all the queries that the SQL trace has captured at its runtime, but the identification of a particular query can be done using the PID – Process ID which is displayed as the first column of the above screen shot. For example, 896 is the process ID for one of the SQL statements.
Summary of a particular trace
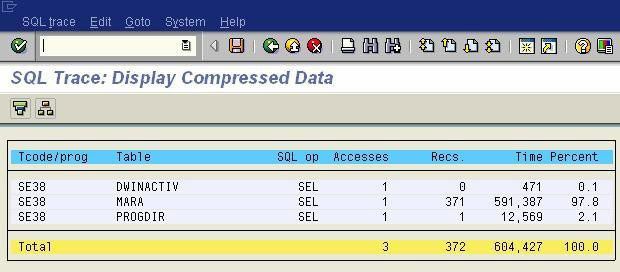
To get the total execution time, specifically for a particular SQL Statement, select all the PID corresponding to it and click summarize in the application toolbar. This leads to a compressed data of SQL trace as above.
Color legends indicating the processes in a trace 1
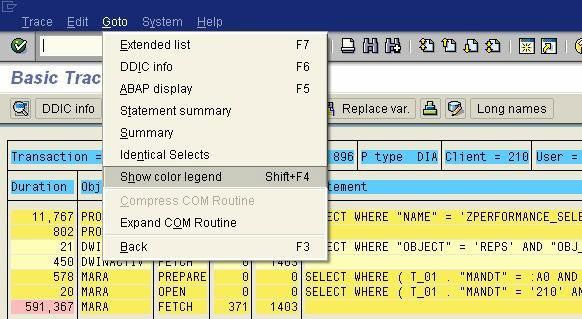
Use the menu path: Goto -> Show color legend to know about the color specification in the trace.
Color legends indicating the processes in a trace 2
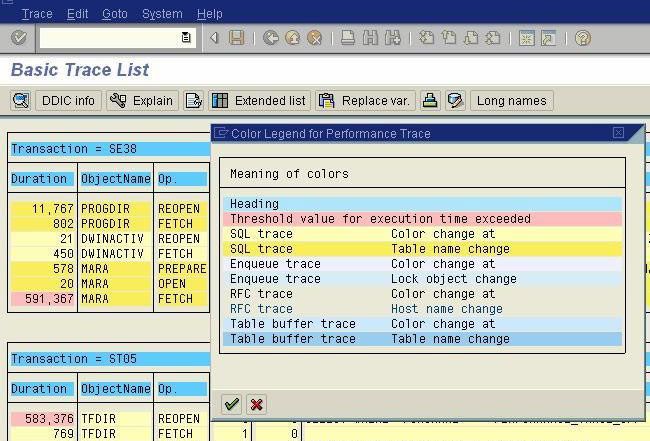
The above screen shot indicates that the query execution time has exceeded its threshold with the link pink color. A change in object name is indicated with the change in color to yellow. These colors thereby indicate whether the query is well written and also the current status of the database server.
Extended list
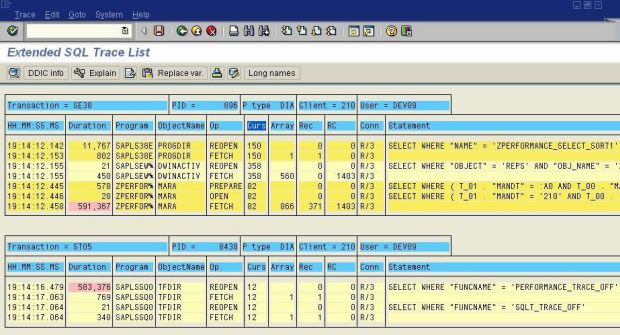
(From basic trace list: click extended list button in application toolbar to view the extended list).The extended list shows the cursor Id declared for the SQL statement, the connection type also.
Cursors: A cursor is a handle or name for an area in memory in which a parsed statement and other information for processing the statement are kept; such an area is also called a private SQL area. Although most Oracle users rely on the automatic cursor handling of the Oracle utilities, the programmatic interfaces offer application designers more control over cursors. In application development, a cursor is a named resource available to a program and can be used specifically for the parsing of SQL statements embedded within the application.
Identical Select Statements
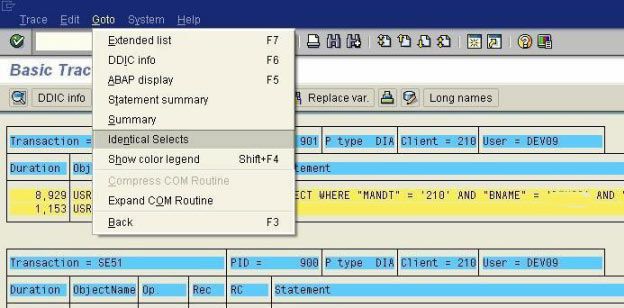
Use the menu path: Goto Identical Selects to view a comprehensive list of identical select statements executed during the trace and the number of times they were executed. Identical select statements are grouped based on the where clause.
Note: Identical select statements have similar execution plan used for their processing thereby saving the time of execution and provide increased performance, too.
Identical select statements displayed
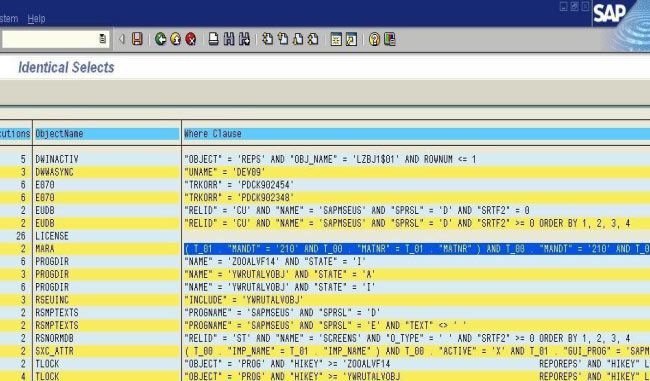
The above screen shot shows the list of identical select statements and the number of time they got executed.
Database Operations Measured by SQL Trace
The SQL Trace analysis helps in measuring the execution time of the following data base operations that are performed when executing an SQL statement.
- DECLARE: This operation declares a new cursor and assigns the SQL statement to that cursor created.
- PREPARE: This operation converts the SQL statement into native SQL and frames out an execution plan for that statement.
- OPEN: This operation opens the declared cursor and passes the parameters for database access.
- FETCH: This operation passes one or more data records fetched to the database interface of the R/3 system.
- REOPEN: Once a new select statement is brought in then this operation opens the cursor previously declared for previous select statement and performs new parameter passing to the database.
- EXEC: Passes the parameters for the database statement, and executes the statements that change data in the database (such as UPDATE, DELETE, or INSERT).
Overview
SQL – Trace analysis is one of the effective tools available with SAP for performance analysis of different sql statements. It helps to analyse the % of access of different tables for a job. Also it helps us to identify deadlock of table access.
Procedure
In this window USER NAME: username for that job. (If you want Usertrace).
OR
In Procee ID: mention the PID of that job (if you want PID Trace).
SQL trace: switched on for USER.
Wait for Some time (i.e 5/10 minutes or depends on the filesize allocated for that instance file in that instance). If it exceeds the size it will overwrite the original.
For Example SQL Trace Filename: /usr/sap///log/TRACE.
#cd /usr/sap///log.
Then copy the trace file as per Convention.(JOB_USER_Servername_date{yyyymmdd}.trc)
For e.g. trace of RP for user ZRPLBATCH on server SUN013_01 on date 20030515 will be “RP_ZRPLBATCH_SUN013_01_20030515.trc”
In this screen enter Trace File Path: /usr/sap///log/sample001 (for example)
Username :
Object name :
Then Choose Enter
It will prompt you Number of Trace record Window ----- Choose “YES”.
You will get the Screen “Basic Trace List”.
Find out the Name of the TABLES/SQL statements.
a. For finding out OPTIMIZING Statistics
Goto T-Code DB20 --- enter the Table name. then press “ Refresh Information”.
b. For finding out the SQL Querry is taking long time for complete the processing.