The user notices performance slowdown in Process Integration (PI) or Process Orchestration (PO) Java engine
This slowdown can be following:
- Connection problem with PI Communication Channels
- Navigation problems around the various PI monitoring pages such as slow response time when opening any browser-based URL
- Performance degradation processing messages such as messages stuck in Delivering status; To Be Delivered status etc
- Automatic restarts of individual Java Server Nodes
- High consumption of CPU
SOLUTION
- User need to analyze the following dumps in order to identify Root Cause.
- What particular dump is most useful and it may depend on the actual issue.
- Combination of some or all may be required in order to troubleshoot the issue further.
1) Java Thread Dumps can be used for monitoring Java engine thread activity over a period of time. For this we require 4 Java Thread Dumps which should be taken at the intervals of 30 second, on each Java Server Node (or on the problem node only, if known). The time interval may differ depending on the issue.
These dumps capture a snapshot of the Java Thread activity at a particular point in time. It is essential that the issue is occurring when these dumps are collected, otherwise the dumps do not capture the information we require to analyse.
These are particularly useful for PI Adapter communication issues and PI messages hanging or stuck in Delivering and/or To Be Delivered status.
There are different options for collecting Java Thread Dumps:
All options are listed in SAP Note 1095473 How to get a full thread dump in AS Java.
The XPI Inspector trace with Example 51 (Performance Problem).
Note: if severe performance issues are ongoing then please don't use this option as it is not recommended in these scenarios.
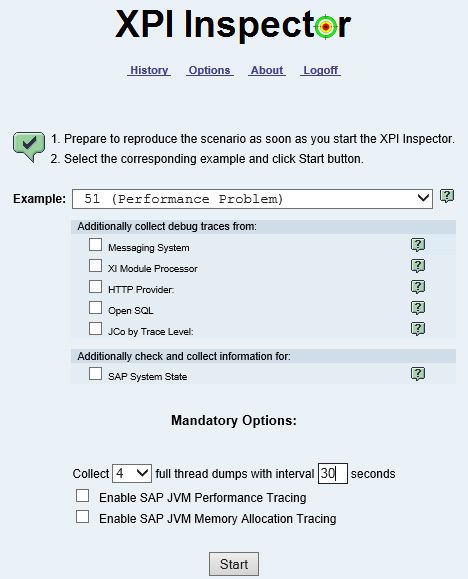
Note: Do not select any of the additional tracing options with this Example as it can distort the output in the Thread Dumps.
Self Analyse
The user can use Thread Dump Viewer tool in order to self-analyse the dumps.
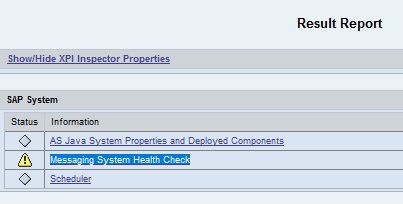
2) XPI Inspector has used issues where messages are stuck/blocked in the Java queues, any XPI Inspector option with the "SAP System State" option selected will collect information regarding which specific adapter queues are blocked. For example, select Example 18 (RWB) with SAP System State and start/stop the trace.
Self Analyse
Open the resulting zip file, click on result.html -> Messaging System Health Check
3) Java Heap Dumps generate a screenshot of all objects using the Java Heap at a given point in time. These are automatically generated when an OutOfMemoryError is encountered but can also be manually generated.
The Java Heap Dump is written to the directory: /usr/sap/<SID>/<INSTANCE>/j2ee/cluster/server<N>/ where N is the server node number.
These are particularly useful for analysing OutOfMemoryErrors and situations where the Java engine has automatically restarted.
4) JVM Profiler is useful to analyze High CPU issues and particularly the duration of method calls.