How to use SAP HANADumpViewer?
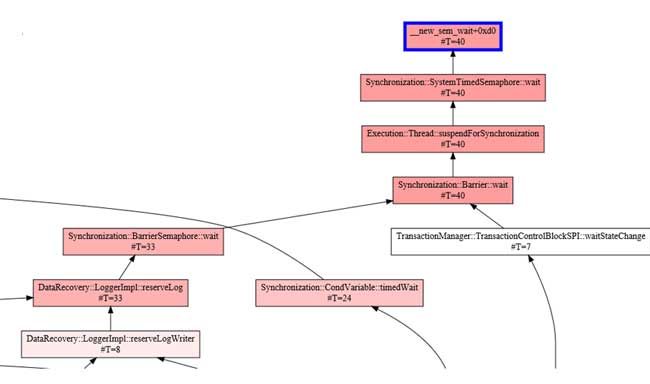
The SAP HANADumpViewer can be utilized for displaying few critical pieces of information in a different way for simplifying the analysis. For instance, it is able to aggregate the thread call stacks graphically for viewing quickly what are the most leading thread activities were.
SAP support has designed this script and this is an expert tool. User is allowed to use it, however, SAP does not take any responsibility for problems which may originate from using this tool.
Solution
SAP HANADumpViewer is primarily a Python script which can be executed directly on an SAP HANA database server (where Python is available per default) with the <sid>adm user or on any other host (including Windows machines) where Python has been installed. It considers the runtime dump file as input and a file in dot format is generated as an output. SAP HANADumpViewer does not connect to the SAP HANA database, so neither credentials nor a running SAP HANA database is required for utilizing it.
We can use SAP HANADumpViewer in order to perform tasks listed below in the table:
|
Task |
Option |
Details |
|
Generation of a graphical call stack hierarchy representation |
-df <rtedump_file> -od <output_directory> |
The below command can be used in order to generate a graphical call stack hierarchy representation: python hanadumpviewer.py -df <rtedump_file> -od <output_directory> The output file will be generated in DOT format and can be displayed with GraphViz tools for example WebGraphviz. The following color conventions can be used by user:
For Example:
|
|
Extracting[INDEXMANAGER_WAITGRAPH] |
-mw |
The section [INDEXMANAGER_WAITGRAPH] of runtime error may already have a wait graph in DOT format. Therefore this section can be written by user to a dedicated file using the "-mw" option. |
|
Extracting of monitoring view data |
-mv |
The [STATISTICS] section of runtime dumps contains raw data for specific monitoring views. User can use "-mv" option in order to extract the different outputs to files in CSV format to evaluate it in Excel easily. |