What does a Calculation View look like?
Under the Calculation View Tab open the pre created Analytic view SALESTEST
When you click on it, on the left side of the canvas you can see the scenario which is created.
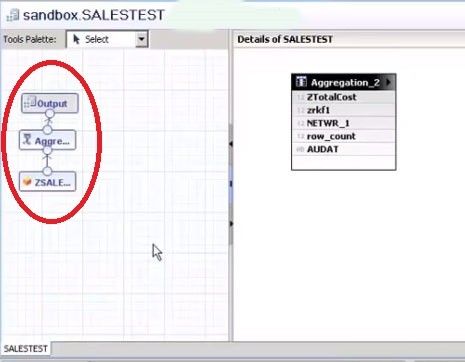
On the right side is the canvas on which you can select what you want to see in your output.
You can see the calculations as well as the measures that you want to add to the output window.
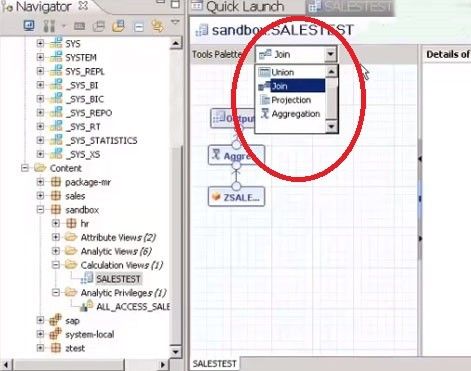
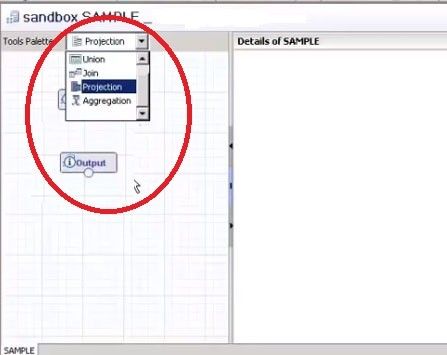
On the top is the Tools Palette where you can select the function depending upon whether you want to create a Join, Union, Aggregate, Projection or Aggregate.
Therefore, these are the primary aspects that are required to create a scenario.
Example:
In this given scenario the attribute ZSALES_DEMO has been used.
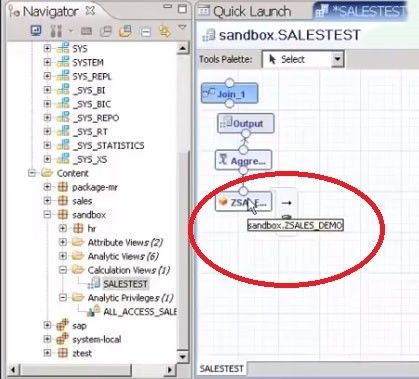
Using this attribute the table that has been created is dragged up and the function Aggregate is carried out.
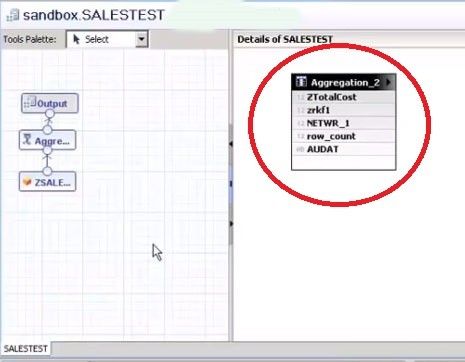
When you click on the Aggregate tab you will see the aggregate that has been done on the values created under the attribute ZSALES_DEMO.
Then when you click on Output you get to see the values that you want in your end result.
Now the last function would be to create a Join.
Therefore, this should help you understand what exactly a calculation view looks like.
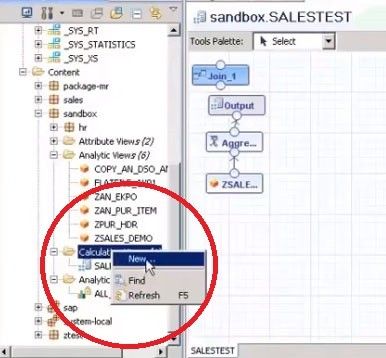
Creating a Calculation View
- Open a New Page
- In the Name and Description section type in the name of your project. (For example SAMPLE)
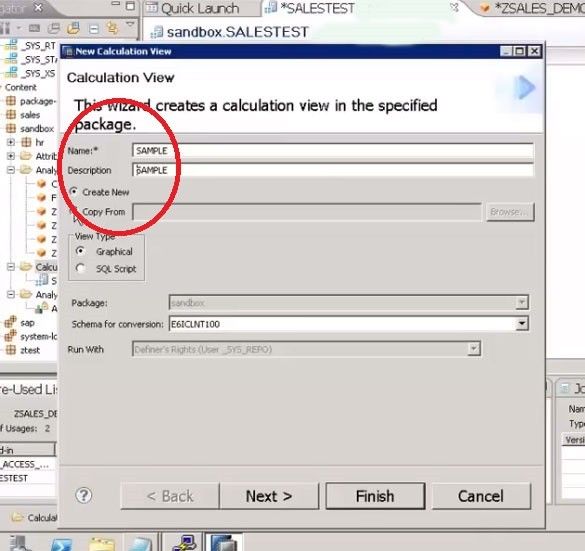
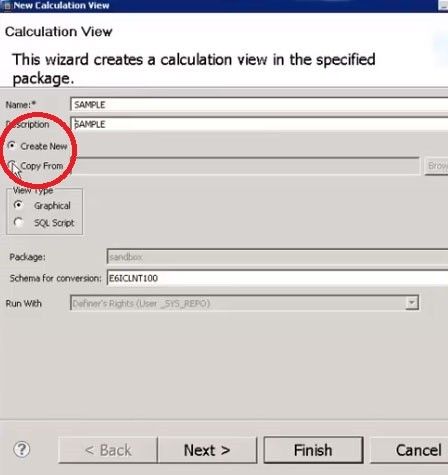
- Click on the radio button Create New
- Select the View type from the two radio buttons which are for Graphical or SQL View.
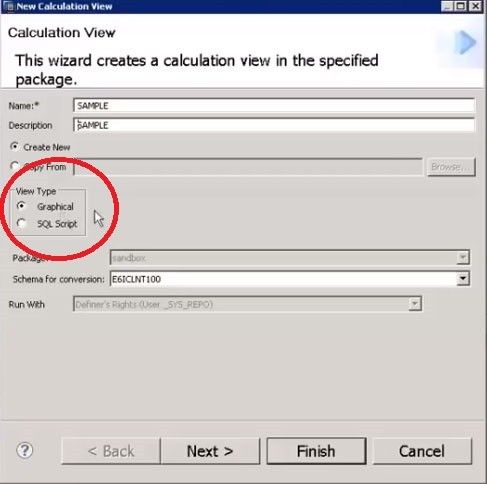
- (The Graphical View is for simple calculations views while the SQL view is for the more complex calculation views.)
- Then click on the schema and select the function that you want to use.
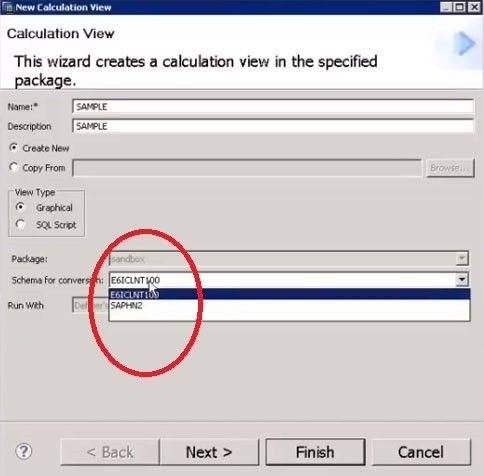
- Then click on the Next button at the end of the page.
- This brings you to the page that lets you select the table from the Catalog and the packages or analytic views from the Content section.
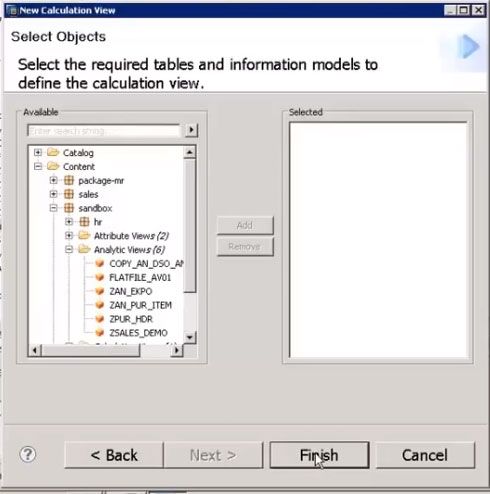
- Once selected, just click on the Finish button at the end of the page.
- This is one way by which a Calculation View can be created.
The next scenario could be one wherein you do not want to click on anything but just execute the Finish command.
There is the Output and the Palette pitch and you can always create scenarios based on this.
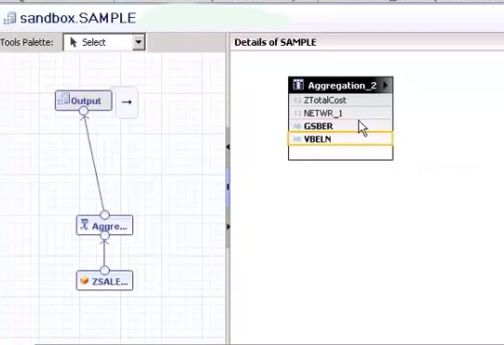
Now if you have to work with the attribute ZSALES_DEMO, you drag it to the left bar of the page and select a function; let’s suppose Aggregate from the tools Palette.
Now when you join the aggregate to the attribute ZSALES_DEMO and click on Aggregate we get to see the complete table on the right side of the page.
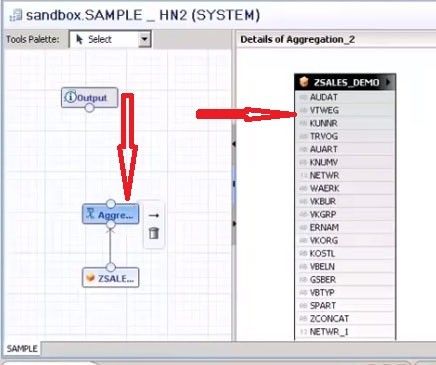
From here you can select the fields that are required for this aggregate.
For example if we need the following for the aggregate columns: ZTotalCost, NETWR_1, GSBER.
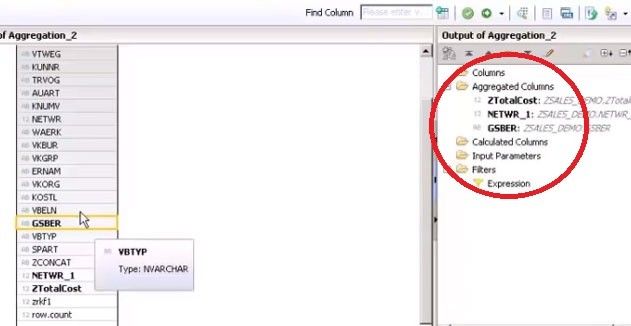
Now if you want these in the Output column, you have to join the aggregate to the output and then you can see the tables which you can respectively assign as Major or attribute.
After creation of the Calculation View you can either Save, Validate or Activate the same and even Deploy it.
Now we can do the Data Preview by clicking in the Data Preview icon which is at the right hand top bar of the page.
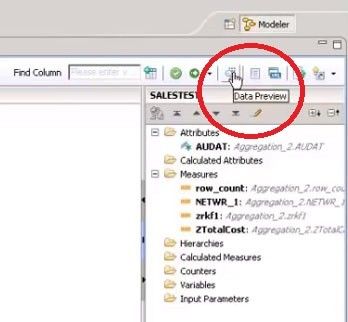
When you click on this icon, on the main page you can see the output data of the query that had been run.
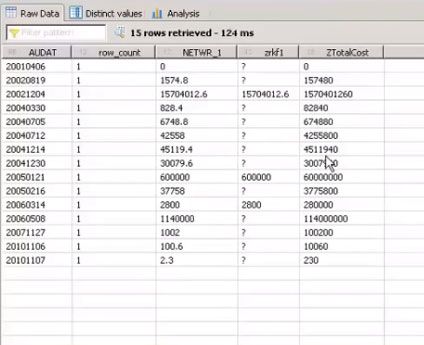
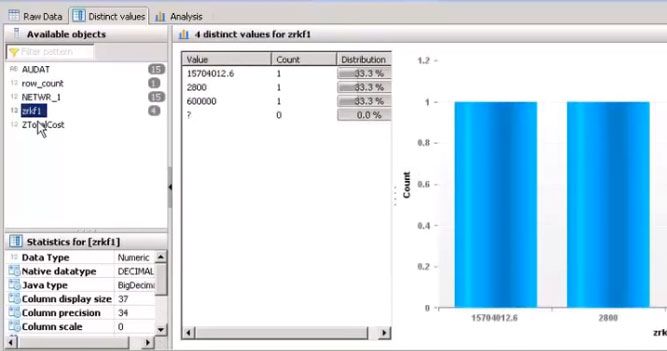
You can also see the Distinct Values and charts by clicking on the Distinct Value Tab.
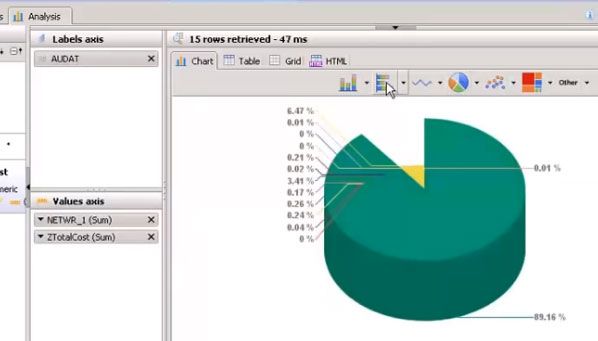
You can also do the analysis and see the same in different format like a bar graph or a pie chart or as a HTML report or even in Grid format by clicking on the Analysis tab.
This summarizes the creation and preview of a Calculation View.
Now let’s look into the Analytic Privilege:
In the analytic privilege we basically define the Controls on the calculation or analytic view.
Read here How to Create the Analytic Privilege for HANA Modeling?