How to handle "Host CPU Usage"?
How to determine that the HANA system has become unresponsive?
When in the Alerts tab, the alert “suse-hanajl01 runs out of CPU resources! CPU consumption user mode 0%, system mode 0%, wio 0%, idle 0%” shows up.
This alert can be found in the HANA studio by following the given path in the directory Administration Console -> Alerts -> Show: all alerts.
.jpg)
This alert can be tracked in the Solution Manager using the following transaction DBACOCKPIT -> choose HANA system -> expand Current Status -> Alerts.
.jpg)
The user may not be able to find the exact time when the alert has occurred as in the Solution Manager the “Check host CPU utilization” alert is automatically refreshed every 15 minutes.
The user can however get the exact time of the alert by going through the following path: Administration Console -> Alerts -> double click on the alerts -> more occurrence for this alert.
.jpg)
Solution:
Ideally the occurrence of this alert is attributed to the following 3 factors:
1.In the "Configure Check Settings", the threshold value of "Check host CPU utilization" is not appropriate.
Note: The default values are: Low: 25, Medium: 15, High: 10.
.jpg)
2.The CPU resources have been utilized in excess.
The following factors, along with many others, are known to contribute to excess utilization of the CPU.
- Implementation of specific programs
- Piling up of data
- Jobs that are slow and keep hanging
- SQL statements that are very lengthy
These factors often put a lot of calculation workload on the CPU, either due to the need to frequently accessing the database or creating links between large tables.
3.Some of the revised versions may have bugs that lead to this alert
As has been seen in previous instances, the user may come across bad query performance with BW on HANA cubes (e.g. by running a query with program RSRT).
To resolve this issue do as following:
Whenever an alert occurs due to inappropriate threshold value setting, resetting it to the default or closest value can often resolve the issue.
.jpg)
When the alert occurs due to excess CPU utilization, the users must refer to SAP Knowledge Based Article 2100040 - FAQ: SAP HANA CPU to get step by step instructions on how to resolve the issue.
When this alert is seen while running a specific program, it can be traced and the trace must include the SQL and performance trace. Both these functions can easily be completed via the Trace Configuration tab.
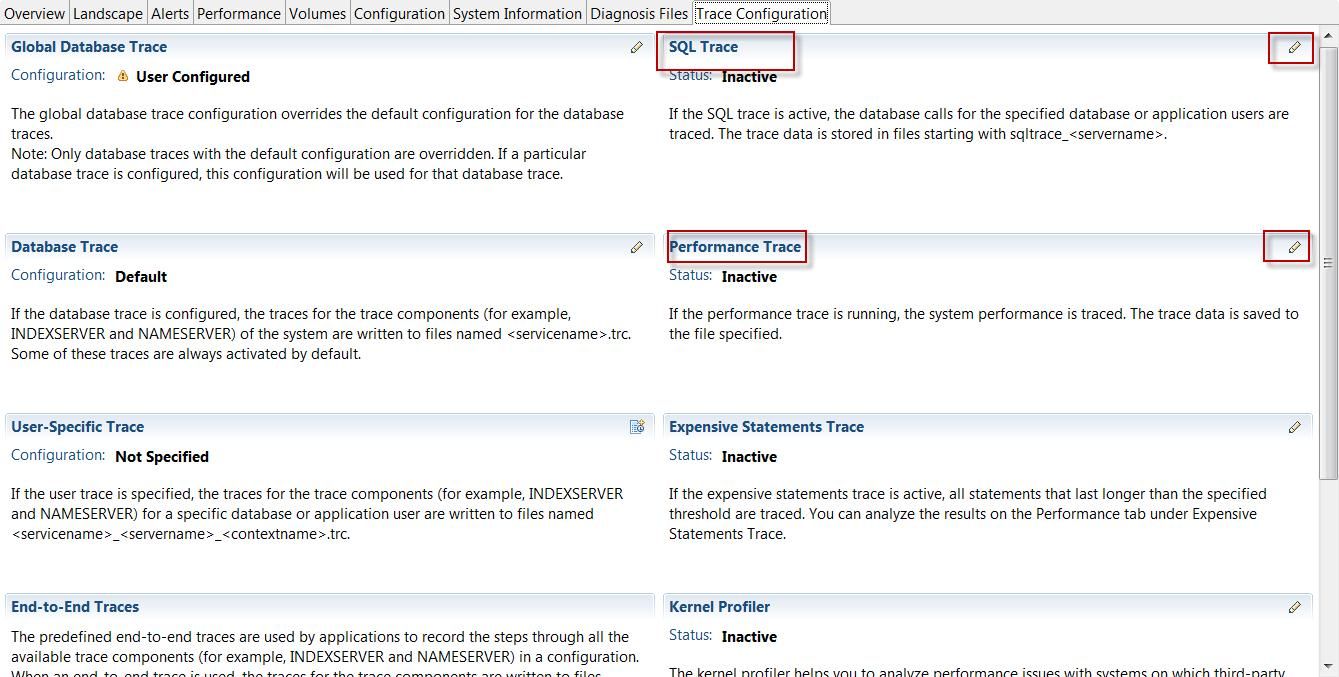
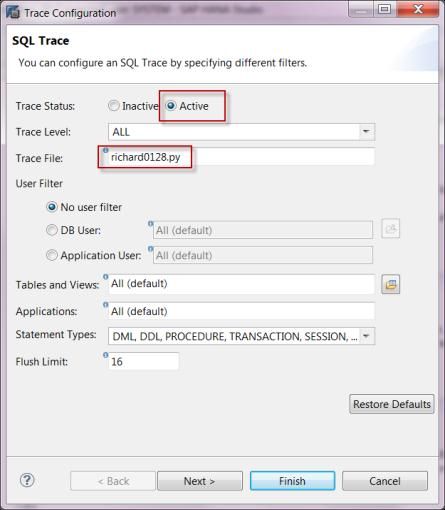
- For the SQL trace, after it is changed to “Active” a new file name must be given before clicking “Finish”.
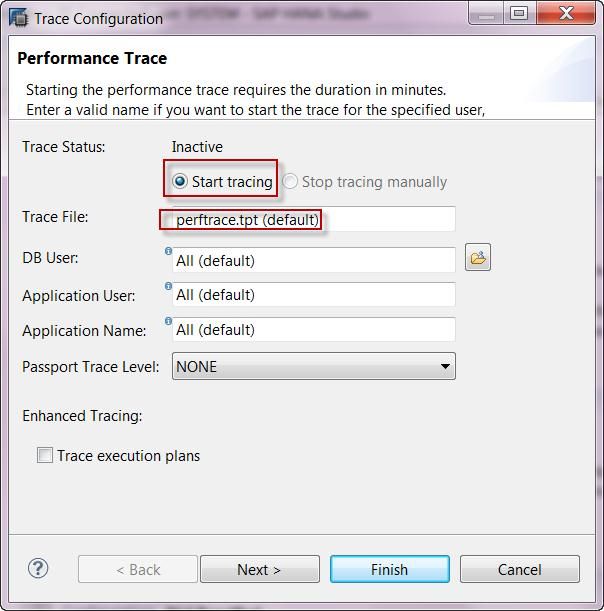
- For the performance trace, just a new file name needs to be given before clicking “Finish”.
By following the given process, a user who is not sure about which process has led to this alert, following the given steps can help in easy identification:
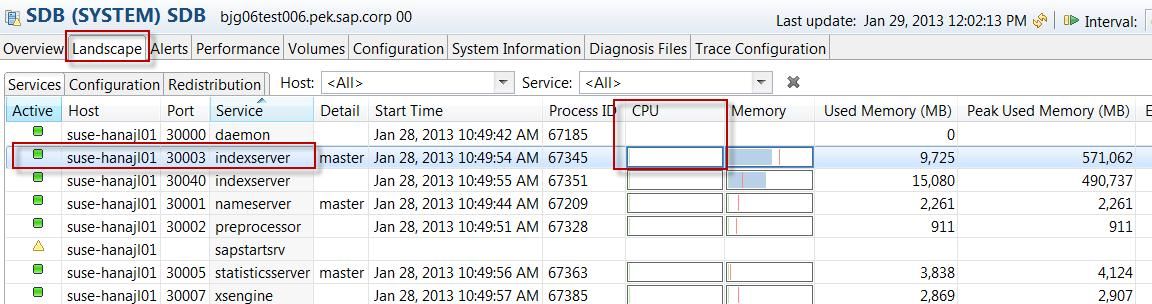
i.Try to find out the server that is facing the high memory consumption error by going to the tap Landscape. E.g: The indexserver with Port 30003 has the highest CPU usage.
ii.The user can then go to Performance and check the threads from there in order to identify which threads are working. E.g: a SQL statement is executed in the figure.
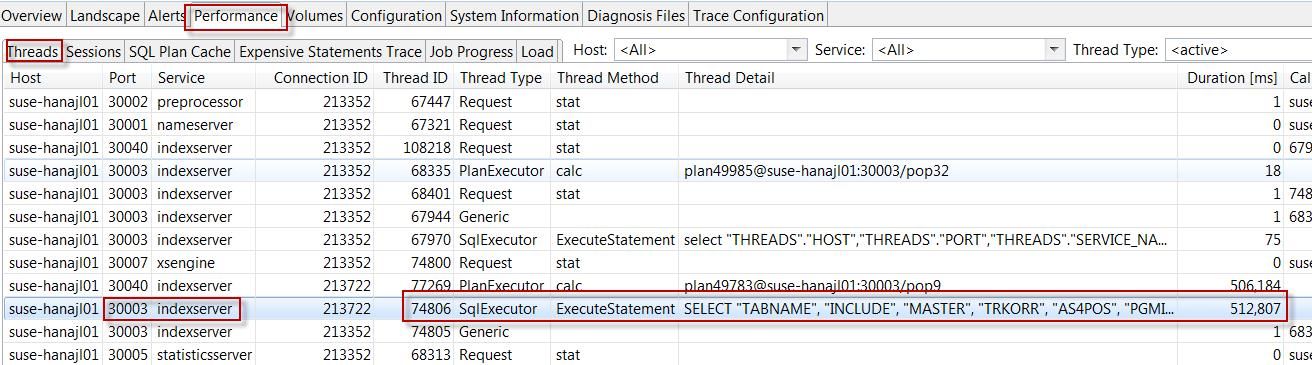
Then the SQL statement can be executed again and if the issue is seen again then it can be conveniently identified that the statement is the cause of the alert.
However, if it cannot be identified as to why the statement leads to High CPU, then the HANA trace needs to be done and the trace files need to be included in the Customer Incident.
In the tab of Diagnosis Files, the trace files can be found. The SQL trace file can be viewed with the help of a double click.
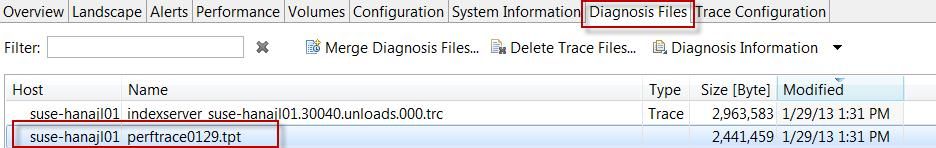
If the performance trace files are to be opened, they need to be opened in the HDBAdmin tool. The page wiki HDBAdmin on Linux on how to execute the tool must be referred to for further clarification.
In order to be able to read the performance trace file, you need to open it in the HDBAdmin tool. Please refer to WIKI page wiki HDBAdmin on Linux on how to execute the tool.
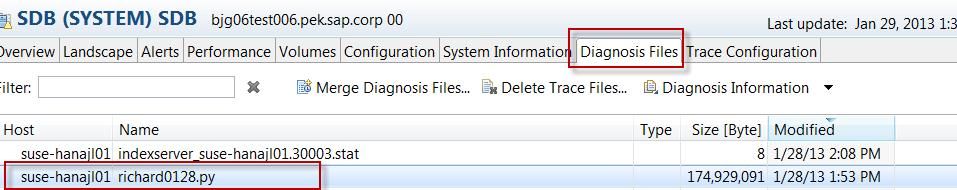
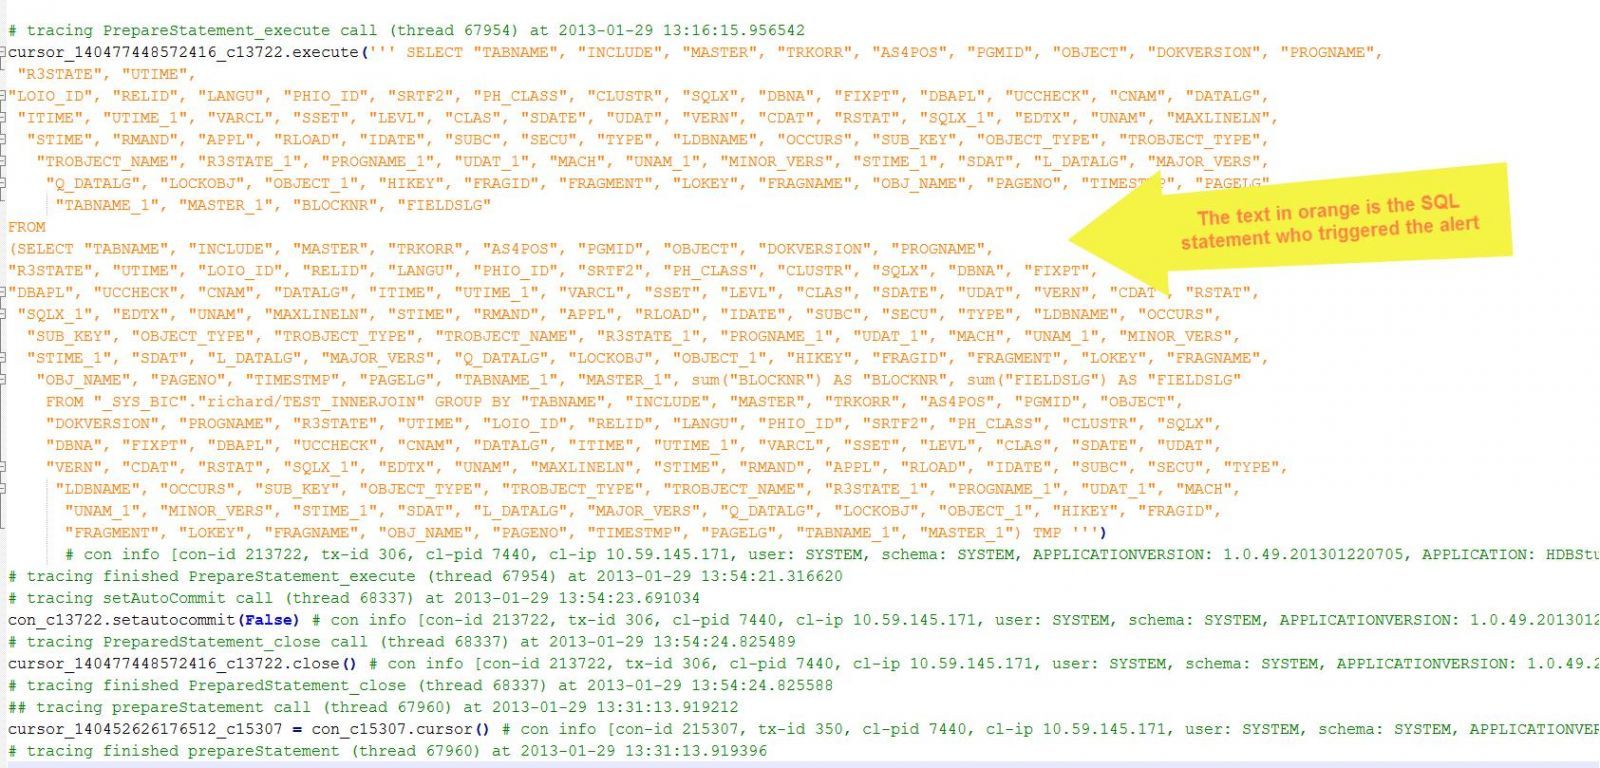
In the SQL trace file (richard0128.py), it can be downloaded to local and opened with Notepad++, following which the SQL tracing info can be found.
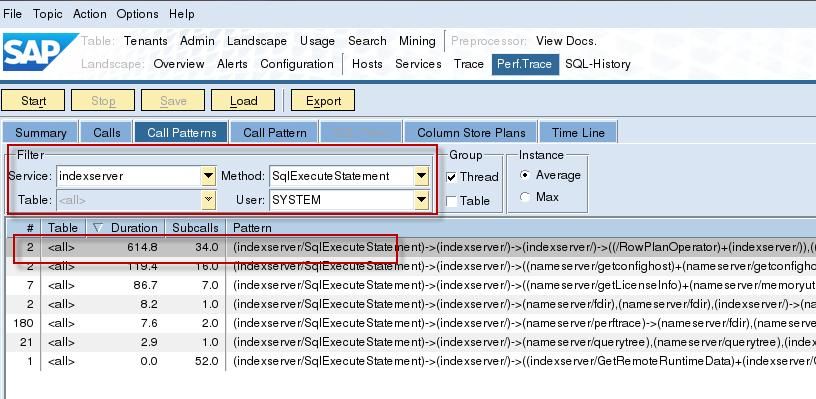
After the environment is ready and the HDBAdmin tool is executed, the .tpt file can be easily loaded and read.
.jpg)
The result can then be filtered with information that is known (e.g Service is indexserver, Method is SqlExecuteStatement, User is SYSTEM) and further analysis can be done on the SQL statement.
It is strongly recommended that the old HANA database revision be upgraded to the latest HANA version.